

Clostridium perfringens epsilon toxin targets granule cells in the mouse cerebellum and stimulates glutamate release
- PMID: 20941361
- PMCID: PMC2948003
- DOI: 10.1371/journal.pone.0013046
Clostridium perfringens epsilon toxin targets granule cells in the mouse cerebellum and stimulates glutamate release
Abstract
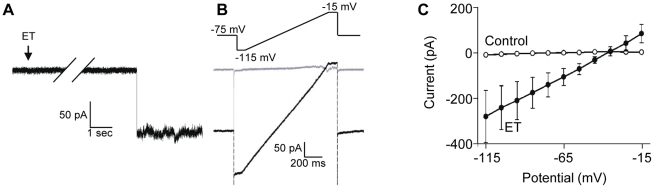
Epsilon toxin (ET) produced by C. perfringens types B and D is a highly potent pore-forming toxin. ET-intoxicated animals express severe neurological disorders that are thought to result from the formation of vasogenic brain edemas and indirect neuronal excitotoxicity. The cerebellum is a predilection site for ET damage. ET has been proposed to bind to glial cells such as astrocytes and oligodendrocytes. However, the possibility that ET binds and attacks the neurons remains an open question. Using specific anti-ET mouse polyclonal antibodies and mouse brain slices preincubated with ET, we found that several brain structures were labeled, the cerebellum being a prominent one. In cerebellar slices, we analyzed the co-staining of ET with specific cell markers, and found that ET binds to the cell body of granule cells, oligodendrocytes, but not astrocytes or nerve endings. Identification of granule cells as neuronal ET targets was confirmed by the observation that ET induced intracellular Ca(2+) rises and glutamate release in primary cultures of granule cells. In cultured cerebellar slices, whole cell patch-clamp recordings of synaptic currents in Purkinje cells revealed that ET greatly stimulates both spontaneous excitatory and inhibitory activities. However, pharmacological dissection of these effects indicated that they were only a result of an increased granule cell firing activity and did not involve a direct action of the toxin on glutamatergic nerve terminals or inhibitory interneurons. Patch-clamp recordings of granule cell somata showed that ET causes a decrease in neuronal membrane resistance associated with pore-opening and depolarization of the neuronal membrane, which subsequently lead to the firing of the neuronal network and stimulation of glutamate release. This work demonstrates that a subset of neurons can be directly targeted by ET, suggesting that part of ET-induced neuronal damage observed in neuronal tissue is due to a direct effect of ET on neurons.
Conflict of interest statement
Figures


Similar articles
-
Epsilon toxin from Clostridium perfringens acts on oligodendrocytes without forming pores, and causes demyelination.Cell Microbiol. 2015 Mar;17(3):369-88. doi: 10.1111/cmi.12373. Epub 2014 Oct 31. Cell Microbiol. 2015. PMID: 25287162
-
Attack of the nervous system by Clostridium perfringens Epsilon toxin: from disease to mode of action on neural cells.Toxicon. 2013 Dec 1;75:122-35. doi: 10.1016/j.toxicon.2013.04.003. Epub 2013 Apr 27. Toxicon. 2013. PMID: 23632158 Review.
-
Subcellular distribution and early signalling events of P2X7 receptors from mouse cerebellar granule neurons.Eur J Pharmacol. 2014 Dec 5;744:190-202. doi: 10.1016/j.ejphar.2014.10.036. Epub 2014 Oct 30. Eur J Pharmacol. 2014. PMID: 25446427
-
L-2-chloropropionic acid inhibits glutamate and aspartate release from rat cerebellar slices but does not activate cerebellar NMDA receptors: implications for L-2-chloropropionic acid-induced neurotoxicity.Neurotoxicology. 1997;18(1):169-77. Neurotoxicology. 1997. PMID: 9215999
-
Glutamate receptor antibodies in neurological diseases: anti-AMPA-GluR3 antibodies, anti-NMDA-NR1 antibodies, anti-NMDA-NR2A/B antibodies, anti-mGluR1 antibodies or anti-mGluR5 antibodies are present in subpopulations of patients with either: epilepsy, encephalitis, cerebellar ataxia, systemic lupus erythematosus (SLE) and neuropsychiatric SLE, Sjogren's syndrome, schizophrenia, mania or stroke. These autoimmune anti-glutamate receptor antibodies can bind neurons in few brain regions, activate glutamate receptors, decrease glutamate receptor's expression, impair glutamate-induced signaling and function, activate blood brain barrier endothelial cells, kill neurons, damage the brain, induce behavioral/psychiatric/cognitive abnormalities and ataxia in animal models, and can be removed or silenced in some patients by immunotherapy.J Neural Transm (Vienna). 2014 Aug;121(8):1029-75. doi: 10.1007/s00702-014-1193-3. Epub 2014 Aug 1. J Neural Transm (Vienna). 2014. PMID: 25081016 Review.
Cited by
-
Clostridium perfringens Epsilon Toxin Compromises the Blood-Brain Barrier in a Humanized Zebrafish Model.iScience. 2019 May 31;15:39-54. doi: 10.1016/j.isci.2019.04.016. Epub 2019 Apr 11. iScience. 2019. PMID: 31030181 Free PMC article.
-
Clostridium perfringens Epsilon-Toxin Impairs the Barrier Function in MDCK Cell Monolayers in a Ca2+-Dependent Manner.Toxins (Basel). 2020 Apr 30;12(5):286. doi: 10.3390/toxins12050286. Toxins (Basel). 2020. PMID: 32365779 Free PMC article.
-
Clostridium perfringens epsilon toxin: a malevolent molecule for animals and man?Toxins (Basel). 2013 Nov 12;5(11):2138-60. doi: 10.3390/toxins5112138. Toxins (Basel). 2013. PMID: 24284826 Free PMC article. Review.
-
Pathology and Pathogenesis of Brain Lesions Produced by Clostridium perfringens Type D Epsilon Toxin.Int J Mol Sci. 2022 Aug 12;23(16):9050. doi: 10.3390/ijms23169050. Int J Mol Sci. 2022. PMID: 36012315 Free PMC article. Review.
-
Fusaricidin-Type Compounds Create Pores in Mitochondrial and Plasma Membranes of Mammalian Cells.Biomolecules. 2019 Sep 1;9(9):433. doi: 10.3390/biom9090433. Biomolecules. 2019. PMID: 31480526 Free PMC article.
References
-
- Sakurai J. Toxins of Clostridium perfringens. Rev Med Microbiol. 1995;6:175–185.
-
- Uzal FA. Diagnosis of Clostridium perfringens intestinal infections in sheep and goats. Anaerobe. 2004;10:135–143. - PubMed
-
- Finnie JW. Neurological disorders produced by Clostridium perfringens type D epsilon toxin. Anaerobe. 2004;10:145–150. - PubMed
-
- Cole AR, Gibert M, Popoff M, Moss DS, Titball RW, et al. Clostridium perfringens ε-toxin shows structural similarity to the pore-forming toxin aerolysin. Nature Struct Mol Biol. 2004;11:797–798. - PubMed
Publication types
MeSH terms
Substances
LinkOut - more resources
Full Text Sources
Miscellaneous
