

Quantitative analysis of immune response and erythropoiesis during rodent malarial infection
- PMID: 20941388
- PMCID: PMC2947982
- DOI: 10.1371/journal.pcbi.1000946
Quantitative analysis of immune response and erythropoiesis during rodent malarial infection
Abstract
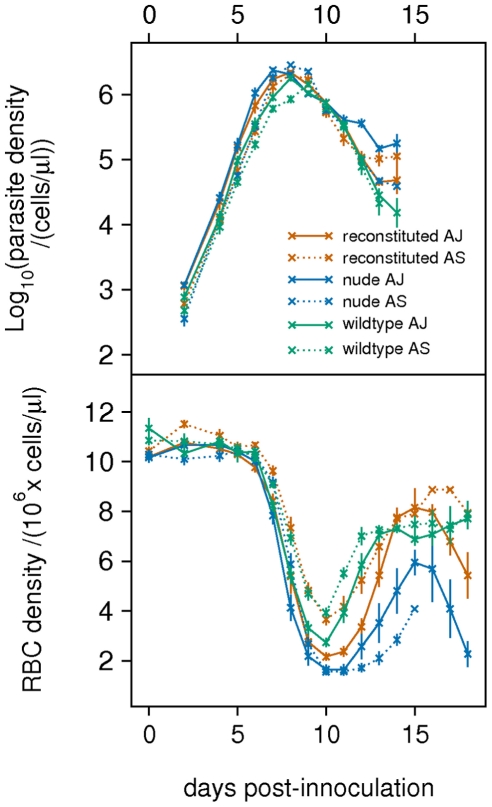
Malarial infection is associated with complex immune and erythropoietic responses in the host. A quantitative understanding of these processes is essential to help inform malaria therapy and for the design of effective vaccines. In this study, we use a statistical model-fitting approach to investigate the immune and erythropoietic responses in Plasmodium chabaudi infections of mice. Three mouse phenotypes (wildtype, T-cell-deficient nude mice, and nude mice reconstituted with T-cells taken from wildtype mice) were infected with one of two parasite clones (AS or AJ). Under a Bayesian framework, we use an adaptive population-based Markov chain Monte Carlo method and fit a set of dynamical models to observed data on parasite and red blood cell (RBC) densities. Model fits are compared using Bayes' factors and parameter estimates obtained. We consider three independent immune mechanisms: clearance of parasitised RBCs (pRBC), clearance of unparasitised RBCs (uRBC), and clearance of parasites that burst from RBCs (merozoites). Our results suggest that the immune response of wildtype mice is associated with less destruction of uRBCs, compared to the immune response of nude mice. There is a greater degree of synchronisation between pRBC and uRBC clearance than between either mechanism and merozoite clearance. In all three mouse phenotypes, control of the peak of parasite density is associated with pRBC clearance. In wildtype mice and AS-infected nude mice, control of the peak is also associated with uRBC clearance. Our results suggest that uRBC clearance, rather than RBC infection, is the major determinant of RBC dynamics from approximately day 12 post-innoculation. During the first 2-3 weeks of blood-stage infection, immune-mediated clearance of pRBCs and uRBCs appears to have a much stronger effect than immune-mediated merozoite clearance. Upregulation of erythropoiesis is dependent on mouse phenotype and is greater in wildtype and reconstitited mice. Our study highlights the informative power of statistically rigorous model-fitting techniques in elucidating biological systems.
Conflict of interest statement
The authors have declared that no competing interests exist.
Figures
 ).
).
 to parasite density and RBC density for reconstituted mice infected with the AJ strain (top panels), or the AS strain (bottom panels). Crosses are data. Light-grey regions correspond to 95% posterior predictive intervals (PPI); dark-grey regions correspond to 50% PPIs. The solid lines give the best-fit (posterior mode) solutions.
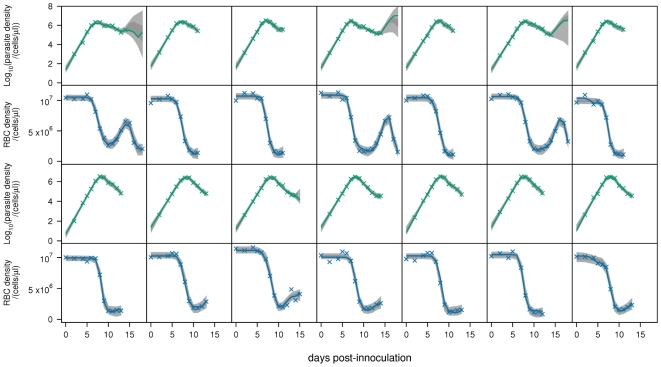
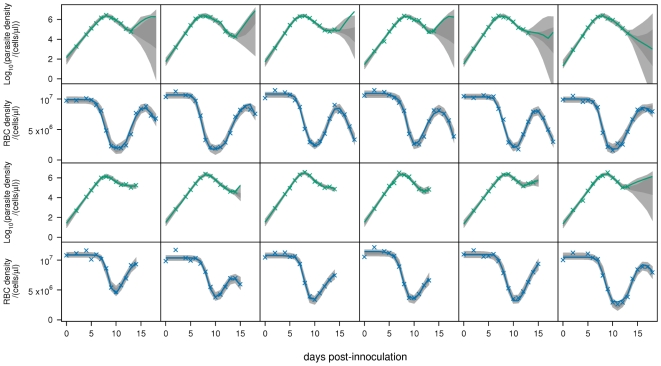
 to parasite density and RBC density for nude mice infected with the AJ strain (top panels), or the AS strain (bottom panels). Crosses are data. Light-grey regions correspond to 95% posterior predictive intervals (PPI); dark-grey regions correspond to 50% PPIs. The solid lines give the best-fit (posterior mode) solutions.
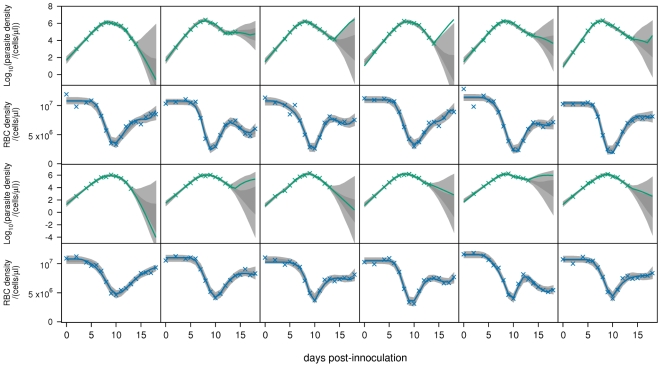
 to parasite density and RBC density for wildtype mice infected with the AJ strain (top panels), or the AS strain (bottom panels). Crosses are data. Light-grey regions correspond to 95% posterior predictive intervals (PPI); dark-grey regions correspond to 50% PPIs. The solid lines give the best-fit (posterior mode) solutions.
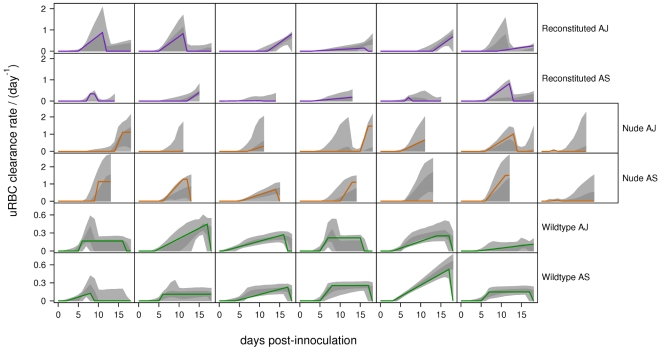
 PPIs; dark grey regions correspond to
  PPIs. The solid lines give the best-fit (posterior mode) solutions. Note the different scales for reconstituted, nude and wildtype mice.
 PPIs; dark grey regions correspond to
  PPIs. The solid lines give the best-fit (posterior mode) solutions.
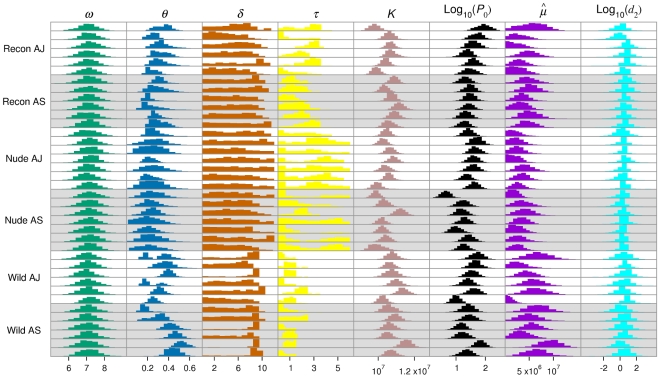
Similar articles
-
Immune-mediated competition in rodent malaria is most likely caused by induced changes in innate immune clearance of merozoites.PLoS Comput Biol. 2014 Jan;10(1):e1003416. doi: 10.1371/journal.pcbi.1003416. Epub 2014 Jan 23. PLoS Comput Biol. 2014. PMID: 24465193 Free PMC article.
-
Top-down or bottom-up regulation of intra-host blood-stage malaria: do malaria parasites most resemble the dynamics of prey or predator?Proc Biol Sci. 2003 Feb 7;270(1512):289-98. doi: 10.1098/rspb.2002.2203. Proc Biol Sci. 2003. PMID: 12614579 Free PMC article.
-
Host control of malaria infections: constraints on immune and erythropoeitic response kinetics.PLoS Comput Biol. 2008 Aug 22;4(8):e1000149. doi: 10.1371/journal.pcbi.1000149. PLoS Comput Biol. 2008. PMID: 18725923 Free PMC article.
-
Malaria, erythrocytic infection, and anemia.Hematology Am Soc Hematol Educ Program. 2009:87-93. doi: 10.1182/asheducation-2009.1.87. Hematology Am Soc Hematol Educ Program. 2009. PMID: 20008186 Free PMC article. Review.
-
Mouse models of blood-stage malaria infections: immune responses and cytokines involved in protection and pathology.Chem Immunol. 2002;80:204-28. doi: 10.1159/000058845. Chem Immunol. 2002. PMID: 12058640 Review. No abstract available.
Cited by
-
The evolution of drug resistance and the curious orthodoxy of aggressive chemotherapy.Proc Natl Acad Sci U S A. 2011 Jun 28;108 Suppl 2(Suppl 2):10871-7. doi: 10.1073/pnas.1100299108. Epub 2011 Jun 20. Proc Natl Acad Sci U S A. 2011. PMID: 21690376 Free PMC article.
-
Insights into mucosal innate responses to Escherichia coli O157 : H7 colonization of cattle by mathematical modelling of excretion dynamics.J R Soc Interface. 2012 Mar 7;9(68):518-27. doi: 10.1098/rsif.2011.0293. Epub 2011 Aug 17. J R Soc Interface. 2012. PMID: 21849385 Free PMC article.
-
Phenotypic plasticity in reproductive effort: malaria parasites respond to resource availability.Proc Biol Sci. 2017 Aug 16;284(1860):20171229. doi: 10.1098/rspb.2017.1229. Proc Biol Sci. 2017. PMID: 28768894 Free PMC article.
-
Differential drivers of intraspecific and interspecific competition during malaria-helminth co-infection.Parasitology. 2021 Aug;148(9):1030-1039. doi: 10.1017/S003118202100072X. Epub 2021 May 11. Parasitology. 2021. PMID: 33971991 Free PMC article.
-
Causes of variation in malaria infection dynamics: insights from theory and data.Am Nat. 2011 Dec;178(6):E174-E188. doi: 10.1086/662670. Epub 2011 Oct 26. Am Nat. 2011. PMID: 22089879 Free PMC article.
References
-
- Organisation WH. World Malaria Report 2009. URL http://www.who.int/malaria/world_malaria_report_2009/en/index.html.
-
- Stevenson MM, Riley EM. Innate immunity to malaria. Nat Rev Immunol. 2004;4:169–180. - PubMed
-
- Miller LH, Baruch DI, Marsh K, Doumbo OK. The pathogenic basis of malaria. Nature. 2002;415:673–679. - PubMed
-
- Wickramasinghe SN, Abdalla SH. Blood and bone marrow changes in malaria. Best Pract Res Cl Ha. 2000;13:277–299. - PubMed
-
- Anderson RM, May RM, Gupta S. Non-linear phenomena in host-parasite interactions. Parasitology. 1989;99:S59–S79. - PubMed
Publication types
MeSH terms
Grants and funding
LinkOut - more resources
Full Text Sources
Medical
Research Materials
