. 2010 Sep 30;6(9):e1001144.
doi: 10.1371/journal.pgen.1001144.

Gene-environment interactions at nucleotide resolution

Affiliations

Gene-environment interactions at nucleotide resolution

Justin Gerke et al. PLoS Genet. .

Abstract

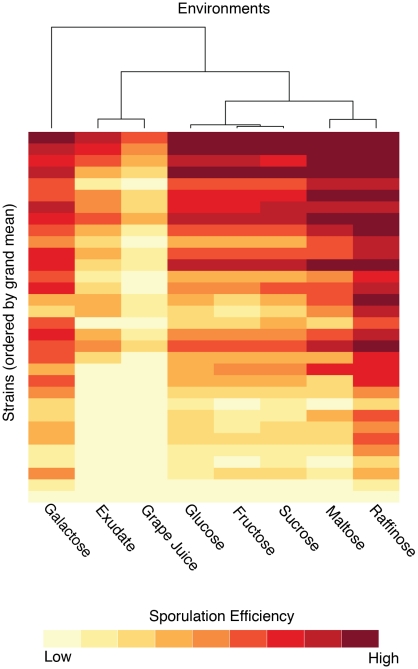
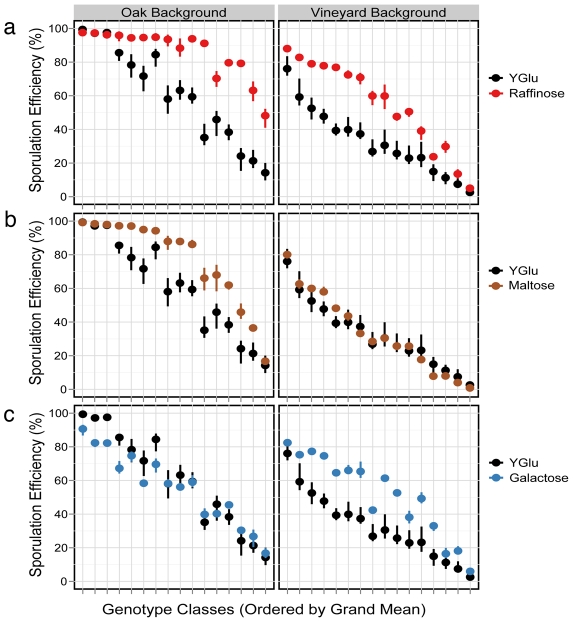
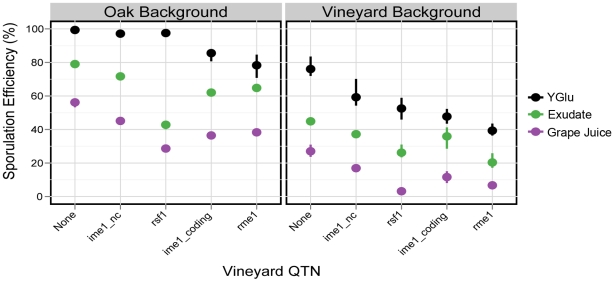
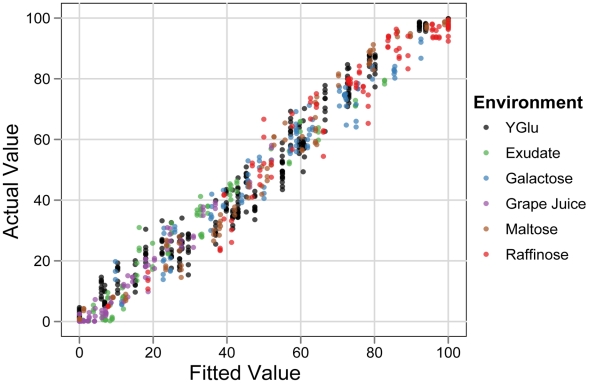
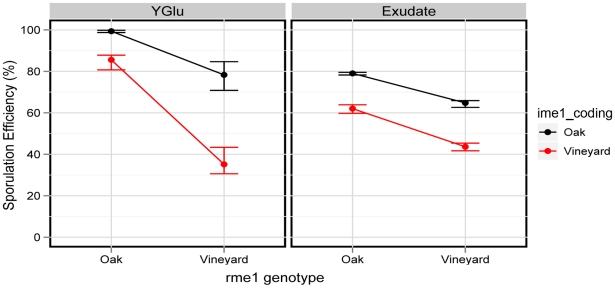
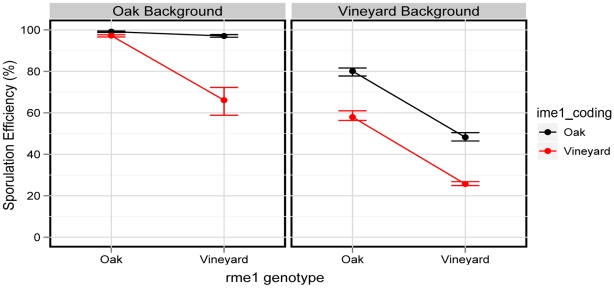
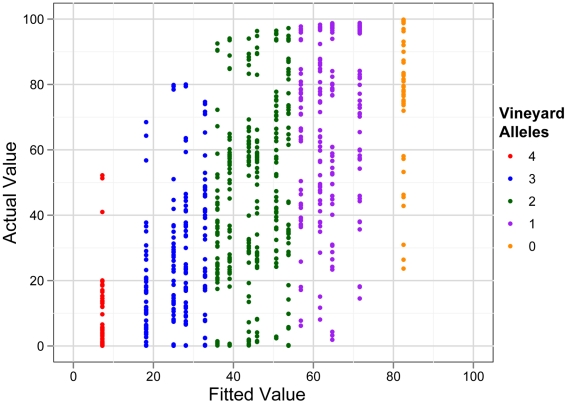
Interactions among genes and the environment are a common source of phenotypic variation. To characterize the interplay between genetics and the environment at single nucleotide resolution, we quantified the genetic and environmental interactions of four quantitative trait nucleotides (QTN) that govern yeast sporulation efficiency. We first constructed a panel of strains that together carry all 32 possible combinations of the 4 QTN genotypes in 2 distinct genetic backgrounds. We then measured the sporulation efficiencies of these 32 strains across 8 controlled environments. This dataset shows that variation in sporulation efficiency is shaped largely by genetic and environmental interactions. We find clear examples of QTN:environment, QTN: background, and environment:background interactions. However, we find no QTN:QTN interactions that occur consistently across the entire dataset. Instead, interactions between QTN only occur under specific combinations of environment and genetic background. Thus, what might appear to be a QTN:QTN interaction in one background and environment becomes a more complex QTN:QTN:environment:background interaction when we consider the entire dataset as a whole. As a result, the phenotypic impact of a set of QTN alleles cannot be predicted from genotype alone. Our results instead demonstrate that the effects of QTN and their interactions are inextricably linked both to genetic background and to environmental variation.


Conflict of interest statement

The authors have declared that no competing interests exist.

Figures

Figure 1
Figure 1. Sporulation efficiencies of the strains clustered by environment.
The dendrogram is constructed from Spearman's rho between environments. The heatmap shows the sporulation efficiencies of the 32 strains in the panel, which consist of all sixteen combinations of the four QTN in both the oak and vineyard backgrounds. The 32 strains are ordered according to their grand mean values across all environments.
Figure 2
Figure 2. Effect of rich media environments (1% yeast extract, 2% peptone) on sporulation efficiency.
Sporulation efficiencies of the strains are split by genetic background. (A) Raffinose. (B) Maltose. (C) Galactose. On the x-axis, the 16 QTN genotype combinations are ordered by their grand mean values across all environments and both genetic backgrounds. Points denote the mean of each strain, and vertical bars denote the full range of values. N = 3 for all environments except YGlu, where N = 9.
Figure 3
Figure 3. QTN effects in exudate and grape juice.
In each genetic background, the strain carrying the oak alleles (None) is plotted along with strains carrying single vineyard QTN alleles. In the oak background, rsf1 has a small effect in YGlu but the largest effect of any QTN in exudate and grape juice. In the vineyard background, the effect of rsf1 is similar across all three environments. Points denote the mean values of each strain, and vertical bars denote the range. N = 3 for exudate and grape juice, and N = 9 for YGlu.
Figure 4
Figure 4. Linear model of sporulation efficiency.
Actual sporulation efficiency of strain replicates plotted as a function of the values fitted from the global model, which uses three-way interactions to account for QTN genotypes as well as genetic background and environment. Fitted values were forced to fall between the range of 0 and 100%. The average deviation of all points from their fitted values is 4.6%.
Figure 5
Figure 5. The rme1:ime1_coding interaction is environment-dependent in the oak background.
The interaction plots show the rme1 genotype on the x-axis. The ime1_coding genotype is signified by the black (oak allele) and red (vineyard allele) lines. The left panel shows the phenotypes of allelic combinations in YGlu, and the right panel shows the same allelic combinations in exudate. The vineyard polymorphisms have a synergistic effect in YGlu, as evidenced by the change in slope between the two lines. The polymorphisms have independent effects in exudate, as evidenced by parallel lines. Points denote the mean of each strain and error bars denote the range.
Figure 6
Figure 6. The rme1:ime1_coding interaction is background-dependent.
Interaction plot of the allelic set in Maltose. The left panel shows the allelic combinations in the oak background, and the right panel shows the vineyard background. An interaction occurs in the oak background, as evidenced by the change in slope between the two lines. This interaction does not occur in the vineyard background, as evidenced by parallel lines. Points denote the mean of each strain and error bars denote the range.
Figure 7
Figure 7. QTN only model of sporulation efficiency.
Actual versus fitted values of a statistical model when environment and genetic background are uncontrolled. The fit is poorer when environment and background are ignored (compare to Figure 4). The model fit is better for strains with all vineyard QTN alleles (red points) than for strains with mixtures of oak and vineyard alleles.

References

    1. Ungerer MC, Halldorsdottir SS, Purugganan MD, Mackay TFC. Genotype-environment interactions at quantitative trait loci affecting inflorescence development in Arabidopsis thaliana. Genetics. 2003;165:353–365. - PMC - PubMed
    1. Smith EN, Kruglyak L. Gene-environment interaction in yeast gene expression. PLoS Biol. 2008;6:e83. doi: 10.1371/journal.pbio.0060083. - DOI - PMC - PubMed
    1. Gurganus MC, Fry JD, Nuzhdin SV, Pasyukova EG, Lyman RF, et al. Genotype-environment interaction at quantitative trait loci affecting sensory bristle number in Drosophila melanogaster. Genetics. 1998;149:1883–1898. - PMC - PubMed
    1. Lillehammer M, Goddard M, Nilsen H. Quantitative Trait Locus-by-Environment Interaction for Milk Yield Traits on Bos taurus Autosome 6. Genetics. 2008;179:1539–1546. - PMC - PubMed
    1. Yaffe K, Haan M, Byers A, Tangen C, Kuller L. Estrogen use, APOE, and cognitive decline: evidence of gene-environment interaction. Neurology. 2000;54:1949–1954. - PubMed

Publication types