Plasmacytoid dendritic cells in tolerance
- PMID: 20941607
- PMCID: PMC3721973
- DOI: 10.1007/978-1-60761-869-0_9
Plasmacytoid dendritic cells in tolerance
Abstract
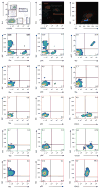
Dendritic cells (DC) are professional antigen-presenting cells (APCs) that modulate the outcome of the immune response toward immunity or tolerance. There are a large variety of DC subsets according to surface phenotype, function, and tissue distribution. Murine plasmacytoid DC (pDC) represent a distinctive DC population and are characterized by the expression of CD11c, B220, Gr-1, CD45RA, Ly49Q, BST2, and siglec-H on the cell surface. PDC act as immunogenic cell sentinels by secreting large amounts of type I interferon (IFN) in the lymph nodes in response to viral stimulation. PDC also act as tolerogenic cells when expressing the inducible tolerogenic enzyme indoleamine 2,3-dioxygenase (IDO), the inducible costimulator ligand (ICOS-L), and/or the programmed death 1 ligand (PD-L1), which mediate regulatory T-cell (Treg) development and suppression of self- and alloreactive cells. The PDC ability to induce Treg development is associated with capture and presentation of antigenic peptides associated with major histocompatibility complex (MHC) class I and II. Here, we provide the tools to study PDC development from bone marrow cultures, their antigen presentation properties, and their interactions with Treg under a tolerogenic setting of sterile inflammation.
Figures


Similar articles
-
Poor allostimulatory function of liver plasmacytoid DC is associated with pro-apoptotic activity, dependent on regulatory T cells.J Hepatol. 2008 Dec;49(6):1008-18. doi: 10.1016/j.jhep.2008.07.028. Epub 2008 Sep 29. J Hepatol. 2008. PMID: 18926588 Free PMC article.
-
Mouse strain differences in plasmacytoid dendritic cell frequency and function revealed by a novel monoclonal antibody.J Immunol. 2003 Dec 15;171(12):6466-77. doi: 10.4049/jimmunol.171.12.6466. J Immunol. 2003. PMID: 14662846
-
Murine plasmacytoid pre-dendritic cells generated from Flt3 ligand-supplemented bone marrow cultures are immature APCs.J Immunol. 2002 Dec 15;169(12):6711-9. doi: 10.4049/jimmunol.169.12.6711. J Immunol. 2002. PMID: 12471102
-
Provision of antifungal immunity and concomitant alloantigen tolerization by conditioned dendritic cells in experimental hematopoietic transplantation.Blood Cells Mol Dis. 2008 Jan-Feb;40(1):55-62. doi: 10.1016/j.bcmd.2007.06.016. Epub 2007 Sep 10. Blood Cells Mol Dis. 2008. PMID: 17827038 Review.
-
Tolerogenic plasmacytoid DC.Eur J Immunol. 2010 Oct;40(10):2667-76. doi: 10.1002/eji.201040839. Eur J Immunol. 2010. PMID: 20821731 Free PMC article. Review.
Cited by
-
Distinct B-Cell Specific Transcriptional Contexts of the BCL2 Oncogene Impact Pre-Malignant Development in Mouse Models.Cancers (Basel). 2022 Oct 29;14(21):5337. doi: 10.3390/cancers14215337. Cancers (Basel). 2022. PMID: 36358756 Free PMC article.
-
Impaired activation of plasmacytoid dendritic cells via toll-like receptor 7/9 and STING is mediated by melanoma-derived immunosuppressive cytokines and metabolic drift.Front Immunol. 2024 Jan 3;14:1227648. doi: 10.3389/fimmu.2023.1227648. eCollection 2023. Front Immunol. 2024. PMID: 38239354 Free PMC article.
-
Intragraft CD11b(+) IDO(+) cells mediate cardiac allograft tolerance by ECDI-fixed donor splenocyte infusions.Am J Transplant. 2012 Nov;12(11):2920-9. doi: 10.1111/j.1600-6143.2012.04203.x. Epub 2012 Aug 6. Am J Transplant. 2012. PMID: 22883222 Free PMC article.
-
Organ-specific differences in achieving tolerance.Curr Opin Organ Transplant. 2015 Aug;20(4):392-9. doi: 10.1097/MOT.0000000000000206. Curr Opin Organ Transplant. 2015. PMID: 26147678 Free PMC article. Review.
-
Regulatory dendritic cells for immunotherapy in immunologic diseases.Front Immunol. 2014 Jan 31;5:7. doi: 10.3389/fimmu.2014.00007. eCollection 2014. Front Immunol. 2014. PMID: 24550907 Free PMC article. Review.
References
-
- Onai N, Obata-Onai A, Schmid MA, Ohteki T, Jarrossay D, Manz MG. Identification of clonogenic common Flt3+M-CSFR+ plasmacytoid and conventional dendritic cell progenitors in mouse bone marrow. Nat Immunol. 2007;8:1207–1216. - PubMed
-
- Naik SH, Sathe P, Park HY, Metcalf D, Proietto AI, Dakic A, Carotta S, O’Keeffe M, Bahlo M, Papenfuss A, et al. Development of plasmacytoid and conventional dendritic cell subtypes from single precursor cells derived in vitro and in vivo. Nat Immunol. 2007;8:1217–1226. - PubMed
-
- Omatsu Y, Iyoda T, Kimura Y, Maki A, Ishimori M, Toyama-Sorimachi N, Inaba K. Development of murine plasmacytoid dendritic cells defined by increased expression of an inhibitory NK receptor, Ly49Q. J Immunol. 2005;174:6657–6662. - PubMed
-
- Zhang J, Raper A, Sugita N, Hingorani R, Salio M, Palmowski MJ, Cerundolo V, Crocker PR. Characterization of Siglec-H as a novel endocytic receptor expressed on murine plasmacytoid dendritic cell precursors. Blood. 2006;107:3600–3608. - PubMed
Publication types
MeSH terms
Grants and funding
LinkOut - more resources
Full Text Sources
Other Literature Sources
Research Materials
Miscellaneous

