

Loss of WNT-TCF addiction and enhancement of HH-GLI1 signalling define the metastatic transition of human colon carcinomas
- PMID: 20941789
- PMCID: PMC3394505
- DOI: 10.1002/emmm.201000098
Loss of WNT-TCF addiction and enhancement of HH-GLI1 signalling define the metastatic transition of human colon carcinomas
Abstract
Previous studies demonstrate the initiation of colon cancers through deregulation of WNT-TCF signalling. An accepted but untested extension of this finding is that incurable metastatic colon carcinomas (CCs) universally remain WNT-TCF-dependent, prompting the search for WNT-TCF inhibitors. CCs and their stem cells also require Hedgehog (HH)-GLI1 activity, but how these pathways interact is unclear. Here we define coincident high-to-low WNT-TCF and low-to-high HH-GLI transitions in patient CCs, most strikingly in their CD133(+) stem cells, that mark the development of metastases. We find that enhanced HH-GLI mimics this transition, driving also an embryonic stem (ES)-like stemness signature and that GLI1 can be regulated by multiple CC oncogenes. The data support a model in which the metastatic transition involves the acquisition or enhancement of a more primitive ES-like phenotype, and the downregulation of the early WNT-TCF programme, driven by oncogene-regulated high GLI1 activity. Consistently, TCF blockade does not generally inhibit tumour growth; instead, it, like enhanced HH-GLI, promotes metastatic growth in vivo. Treatments for metastatic disease should therefore block HH-GLI1 but not WNT-TCF activities.
Figures
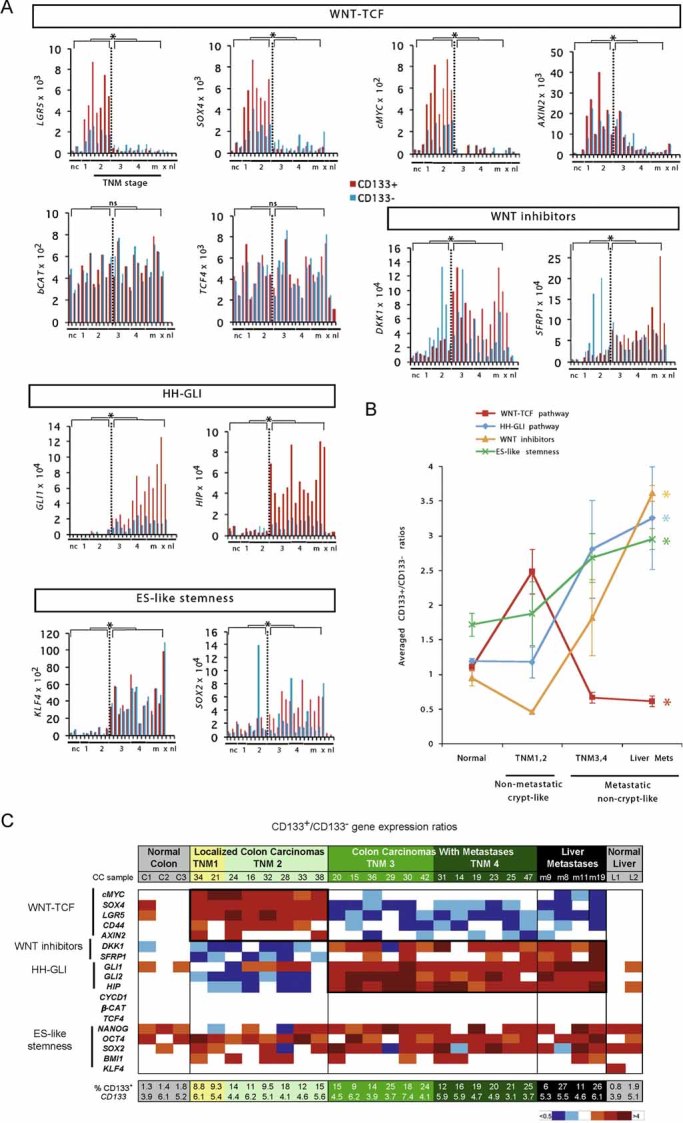
Histograms of individual changes in gene expression determined by qRT-PCR in individual patient tumour samples, obtained from the operating room, for both CD133+ (red bars) and CD133− (blue bars) cells of each sample for WNT-TCF, HH-GLI, ES-like stemness and WNT-inhibitors (additional genes are shown in Fig S1 and in Varnat et al, 2009). CCs are grouped by TNM stage (numerals) plus liver metastases (m). Normal colon (nc) and normal liver (nl), and subcutaneous xenografts (x; mCC17) are also included. Description of tumours is as in Varnat et al (2009). Values for GLI1 and HIP are from Varnat et al (2009) shown here for comparison. In all cases ct expression levels are normalized by the geometric mean of the ct values of the EEFIA1 and GAPDH, yielding relative expression levels. Statistics comparing TNM1,2 versus TNM3,4 plus liver metastases are shown by the brackets above each graph. Error bars of s.e.m.'s are not included to enhance clarity. However, asterisks show significance (p < 0.05) using the Student's t-test between CD133+ (red columns) values of TNM1,2 versus those of TNM3,4+ metastases. ns: not significant. In addition, we provide individual comparisons of TNM1,2 versus TNM3,4 and statistics: the CD133+/CD133− ratios were: LGR5: 3.2 in TNM1,2 versus 0.5 in TNM3,4, p < 0.001; SOX4: 2.7 versus 0.4, p < 0.001; cMYC: 3.1 versus 0.8, p < 0.001; DKK1: 0.4 versus 2.3, p < 0.001; SFRP1: 0.4 versus 1.3, p < 0.01; SOX2: 1.4 versus 3.3, p = 0.03; AXIN2, a direct TCF target (e.g. Leung et al, 2002), displayed a decreasing trend in both populations but significantly only in CD133+ cells (19.9 vs. 6.5, p < 0.01); KLF4 showed increased expression in both CD133+ and CD133− populations in metastatic versus non-metastatic CCs: 7.7-fold increase in CD133+ cells of TNM1,2 versus TNM3,4, p = 0.003; eightfold for CD133− cells, p < 0.0001. Ls = LS174T, HT = HT29. Analyses of gene expression in the GEO database was uninformative since there is no data on CD133+ cells and CCs are not TNM sorted.
Graphic representation of the changes in HH-GLI, WNT-TCF, ES-like stemness and WNT inhibitor signatures in normal colon and during CC progression shown in (Figs 1A; S1). The signatures shown are the averages of the CD133+/CD133− ratios of GLI1, GLI2, PTCH1, SHH, HIP and SNAIL1 for HH-GLI; of cMYC, CD44, LGR5, AXIN2 and SOX4 for WNT-TCF; of NANOG, OCT4, SOX2 and KLF4 for ES-like stemness and of DKK1 and SFRP1 for WNT inhibitors. Asterisks denote significant changes (p < 0.05) between the values of TNM1,2 versus those of liver metastases as indicated by the colour code of the asterisks (e.g. red for HH-GLI).
Heat map representation of individual gene expression levels determined by qRT-PCR shown in (Figs 1A; S1) in normal and cancer samples shown as CD133+/CD133− ratios. White boxes denote values within the 0.7–1.4 ratio range (see Fig S2). Other colours follow the code given below the table. All values are given in Fig S2. The pathway level switch at the metastatic transition from a high-to-low crypt/adenoma WNT-TCF signature in TNM1,2 CCs, to a low-to-high HH-GLI signature in TNM3,4 and liver metastases is highlighted by bold boxes. HH-GLI data is derived from (Varnat et al, 2009). Note that the signatures of xenografts mimic those of advanced TNM3,4 CCs. The percentage of CD133+ cells in each sample is also given at the bottom of the table, as is the normalized CD133+/CD133− expression ratio of CD133 mRNA.
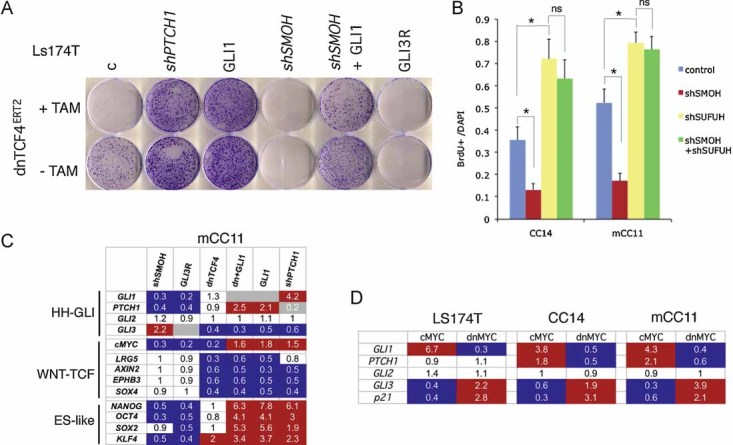
Images of Ls174T-dnTCF4ERT2 colonies on plates after staining with crystal violet. Cells were transduced with lentivectors as noted. Addition of TAM (+TAM) activated dnTCF4ERT2 and is compared with mock-treated cells (−TAM). Control cells (c) were transduced with GFP-only parental lentivectors. Control assays were also performed with the ERT2 part only ±TAM confirming that ERT2 or TAM per se had no adverse effects (not shown). Quantification is shown in Fig S4A.
Quantification of the rescue of the anti-proliferative effects, shown as BrdU+ nuclei/total DAPI-labelled nuclei counted per field, of shSMOH by concomitant inhibition of the GLI inhibitor SUFUH through expression of shSUFUH. Results in two primary CCs are shown as indicated. >10 fields were counted per condition. Asterisks denote significant (p < 0.05) changes in Student's t-tests. ns: not significant. Error bars represent s.e.m.
Heat map of early (16 h) changes of selected key genes for HH-GLI, WNT-TCF and ES-like stemness signatures in mCC11 cells determined by qRT-PCR after expression of cDNAs or shRNAs as indicated. Values are ratios of individual experimental over control (GFP-only transfected cells) values after normalization. Results for CC14 and Ls174T are shown in Fig S4B. White boxes represent ratio values within the 0.7–1.4 range. Blue boxes represent ratio values equal to or smaller than 0.5. Red boxes represent values equal to or greater than 1.5.
Positive regulatory loop between GLI1 and cMYC. mRNA expression levels determined by qRT-PCR are shown as ratios over control transfected (GFP only) cells. Heat map colours and values are as in (C). Enhanced cMYC levels were obtained by its overexpression while blockade of endogenous cMYC activity was obtained through the expression of dnMYC (also known as OMOMYC; Soucek et al, 2002). Note the general differential regulation of GLI1 and PTCH1 versus GLI3 and p21, the latter being a proven cMYC target. GLI2 levels were unaffected. The lack of upregulation of PTCH1, a GLI1 target (Agren et al, 2004), when GLI1 is upregulated by cMYC in Ls174T cells may be due to different target response kinetics (see Zbinden et al, 2010).
 ,
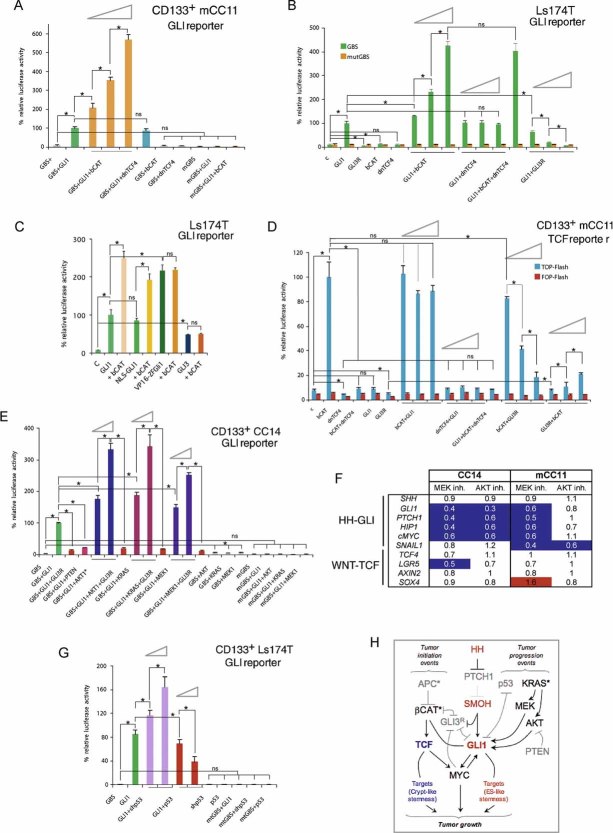
,  and 1/1 ratios were used for the plasmid in second position. Percent changes in relation to the GLI1 value (equated to 100%, all after normalization with the renilla internal control) are shown (A–C, E and G). Percent changes in relation to the βCAT value are shown in (B and D). ns: difference not significant between the samples at the end of the line. Asterisks denote significant (p < 0.05) changes in Student's t-tests. Error bars represent s.e.m.
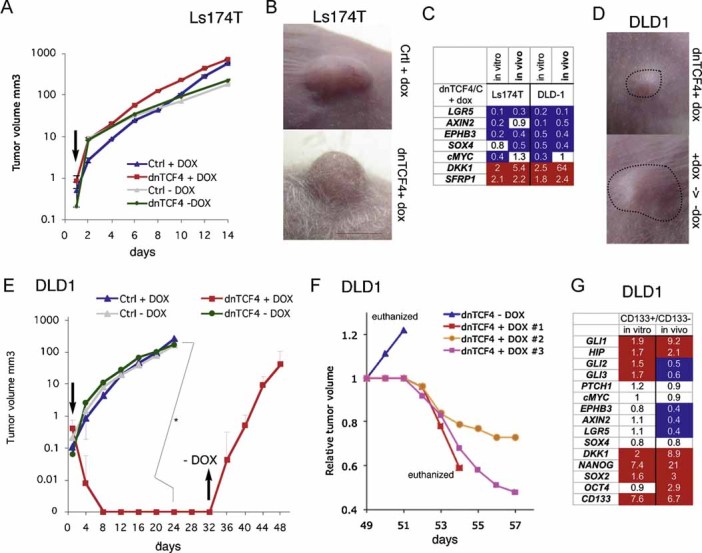
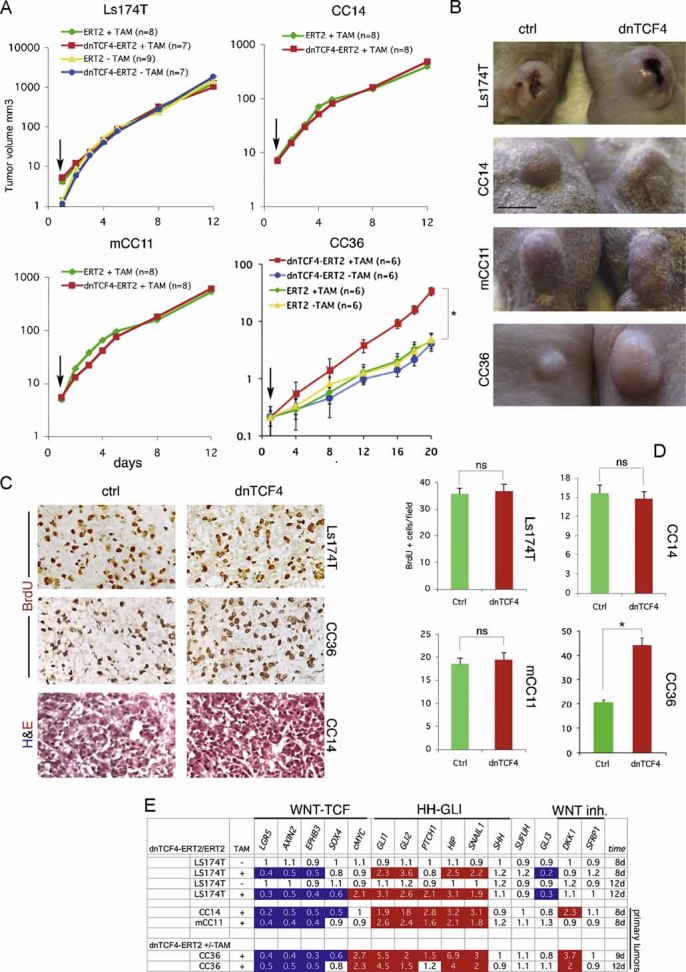
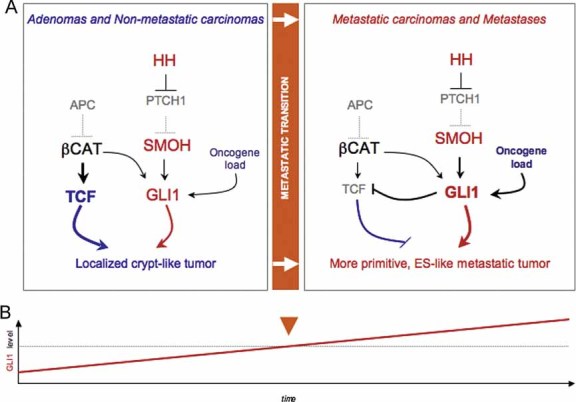
Diagram of the changes in pathway use in non-metastatic versus metastatic CCs, highlighting the metastatic transition and the recapitulation of non-metastatic CCs by in vitro conditions and of metastatic CCs by in vivo xenograft conditions. WNT-TCF and HH-GLI interactions are highlighted.
Model for the proposed role of GLI1 driving the metastatic transition when its activity levels, enhanced by multiple oncogene and loss of tumour suppressor events (the oncogene load), reach a threshold. This model recapitulates morphogenetic gradient interpretation resulting in distinct cell fates during development. Cancer stem cell reprogramming is proposed to be GLI1 driven at the metastatic transition.
Similar articles
-
Human colon cancer epithelial cells harbour active HEDGEHOG-GLI signalling that is essential for tumour growth, recurrence, metastasis and stem cell survival and expansion.EMBO Mol Med. 2009 Sep;1(6-7):338-51. doi: 10.1002/emmm.200900039. EMBO Mol Med. 2009. PMID: 20049737 Free PMC article.
-
Hedgehog signaling and the Gli code in stem cells, cancer, and metastases.Sci Signal. 2011 Nov 22;4(200):pt9. doi: 10.1126/scisignal.2002540. Sci Signal. 2011. PMID: 22114144
-
Metastases and Colon Cancer Tumor Growth Display Divergent Responses to Modulation of Canonical WNT Signaling.PLoS One. 2016 Mar 3;11(3):e0150697. doi: 10.1371/journal.pone.0150697. eCollection 2016. PLoS One. 2016. PMID: 26939070 Free PMC article.
-
Cross-Talk between Wnt and Hh Signaling Pathways in the Pathology of Basal Cell Carcinoma.Int J Environ Res Public Health. 2018 Jul 9;15(7):1442. doi: 10.3390/ijerph15071442. Int J Environ Res Public Health. 2018. PMID: 29987229 Free PMC article. Review.
-
Crosstalk between Wnt/β-catenin and Hedgehog/Gli signaling pathways in colon cancer and implications for therapy.Cancer Biol Ther. 2015;16(1):1-7. doi: 10.4161/15384047.2014.972215. Cancer Biol Ther. 2015. PMID: 25692617 Free PMC article. Review.
Cited by
-
Targeting the Hedgehog Pathway in Cancer: Current Evidence and Future Perspectives.Cells. 2019 Feb 12;8(2):153. doi: 10.3390/cells8020153. Cells. 2019. PMID: 30759860 Free PMC article. Review.
-
A New Smoothened Antagonist Bearing the Purine Scaffold Shows Antitumour Activity In Vitro and In Vivo.Int J Mol Sci. 2021 Aug 4;22(16):8372. doi: 10.3390/ijms22168372. Int J Mol Sci. 2021. PMID: 34445078 Free PMC article.
-
Krüppel-like Factors 4 and 5 in Colorectal Tumorigenesis.Cancers (Basel). 2023 Apr 24;15(9):2430. doi: 10.3390/cancers15092430. Cancers (Basel). 2023. PMID: 37173904 Free PMC article. Review.
-
Hedgehog Gli3 activator signal augments tumorigenicity of colorectal cancer via upregulation of adherence-related genes.Cancer Sci. 2013 Mar;104(3):328-36. doi: 10.1111/cas.12073. Epub 2013 Jan 10. Cancer Sci. 2013. PMID: 23176625 Free PMC article.
-
CtBP2 is an independent prognostic marker that promotes GLI1 induced epithelial-mesenchymal transition in hepatocellular carcinoma.Oncotarget. 2015 Feb 28;6(6):3752-69. doi: 10.18632/oncotarget.2915. Oncotarget. 2015. PMID: 25686837 Free PMC article.
References
-
- Agren M, Kogerman P, Kleman MI, Wessling M, Toftgård R. Expression of the PTCH1 tumor suppressor gene is regulated by alternative promoters and a single functional Gli-binding site. Gene. 2004;330:101–114. - PubMed
-
- Alvarez-Medina R, Cayuso J, Okubo T, Takada S, Martí E. Wnt canonical pathway restricts graded Shh/Gli patterning activity through the regulation of Gli3 expression. Development. 2008;135:237–247. - PubMed
-
- Arimura S, Matsunaga A, Kitamura T, Aoki K, Aoki M, Taketo MM. Reduced level of smoothened suppresses intestinal tumorigenesis by down-regulation of Wnt signaling. Gastroenterology. 2009;137:629–638. - PubMed
-
- Barker N, Clevers H. Mining the Wnt pathway for cancer therapeutics. Nat Rev Drug Discov. 2006;5:997–1014. - PubMed
Publication types
MeSH terms
Substances
LinkOut - more resources
Full Text Sources
Other Literature Sources
Research Materials
