

V600EBraf induces gastrointestinal crypt senescence and promotes tumour progression through enhanced CpG methylation of p16INK4a
- PMID: 20941790
- PMCID: PMC3394506
- DOI: 10.1002/emmm.201000099
V600EBraf induces gastrointestinal crypt senescence and promotes tumour progression through enhanced CpG methylation of p16INK4a
Abstract
The majority of human colorectal cancers (CRCs) are initiated by mutations arising in the adenomatous polyposis coli (APC) tumour suppressor gene. However, a new class of non-APC mutated CRCs has been defined that have a serrated histopathology and carry the (V600E)BRAF oncogene. Here we have investigated the pathogenesis of serrated CRCs by expressing (V600E)Braf in the proliferative cells of the mouse gastrointestinal tract. We show that the oncogene drives an initial burst of Mek-dependent proliferation, leading to the formation of hyperplastic crypts. This is associated with β-catenin nuclear localization by a mechanism involving Mapk/Erk kinase (Mek)-dependent, Akt-independent phosphorylation of Gsk3β. However, hyperplastic crypts remain dormant for prolonged periods due to the induction of crypt senescence accompanied by upregulation of senescence-associated β-galactosidase and p16(Ink4a). We show that tumour progression is associated with down-regulation of p16(Ink4a) through enhanced CpG methylation of exon 1 and knockout of Cdkn2a confirms this gene is a barrier to tumour progression. Our studies identify (V600E)BRAF as an early genetic driver mutation in serrated CRCs and indicate that, unlike APC-mutated cancers, this subtype arises by the bypassing of a (V600E)Braf driven oncogene-induced senescence programme.
Figures
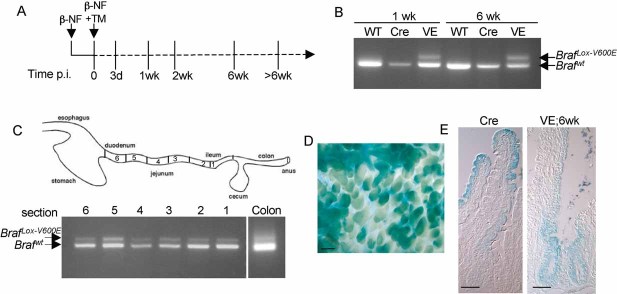
Treatment regime. Braf+/LSL-V600E; AhcreERT+/o or control AhcreERT+/o mice were treated with β-NF followed by β-NF + TM 24 h later and harvested at the time points indicated. The time p.i. represents the length of time following the last β-NF/TM injection.
PCR analysis of BrafLSL-V600E recombination. Genomic DNA was harvested from the small intestine of WT mice, AhcreERT+/o-induced (Cre) or Braf+/LSL-V600E; AhcreERT+/o-induced (VE) mice at 1 or 6 weeks p.i. and subjected to PCR analysis using the primers previously described (Mercer et al, 2005). Recombination of the BrafLSL-V600E allele is indicated by the presence of the BrafLox-V600E PCR product.
Recombination occurs throughout the length of the gut. Small intestinal samples were cut into 6 sections, with section 1 being the ileum and section 6 the duodenum. Genomic DNA was harvested from each, as well as from the colon, and was subjected to PCR analysis using the recombination primers. Recombination of the BrafLSL-V600E allele was detected in all sections of the small intestine and at a lower level in the colon.
Monitoring of Cre-mediated recombination using the Rosa26R reporter transgene. An X-gal whole mount stain of the small intestine from β-NF/TM-treated Braf+/LSL-V600E; AhcreERT+/o; Rosa26R+/o at 6 weeks p.i. was performed and confirms ∼70% Cre-recombination. Bar = 200 µm.
X-gal whole mounts from β-NF/TM-treated Braf+/LSL-V600E; AhcreERT+/o; Rosa26R+/o (VE) or AhcreERT+/o; Rosa26R+/o (Cre) mice at 6 weeks p.i. were sectioned and photographed. Similar patterns of colonization of recombined cells in the crypts and villi expressing V600EBraf compared to WTBraf are observed. Bars = 50 µm.
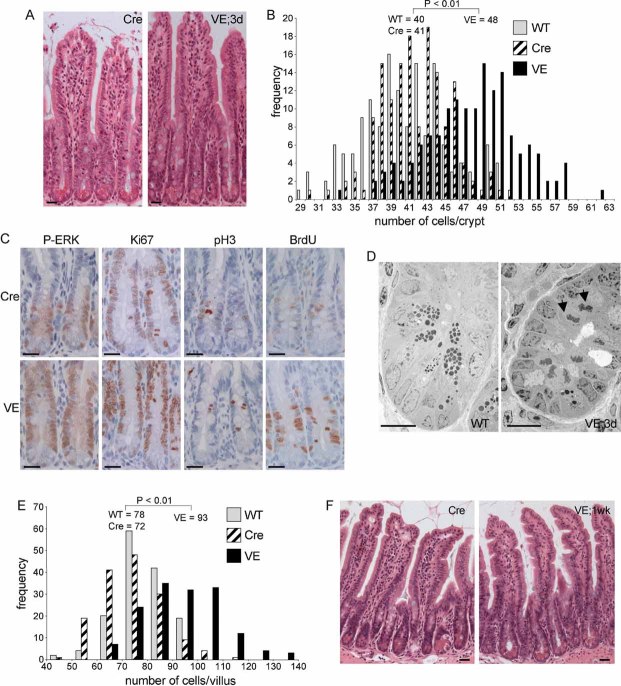
H&E staining of β-NF/TM-treated AhcreERT+/o (Cre) or Braf+/LSL-V600E; AhcreERT+/o (VE) small intestinal sections at 3 days p.i. Bars = 10 µm.
Increased cell number in VE-expressing crypts at 3 days p.i. H&E-stained ‘swiss’ rolls of section 1 (ileum) were scored blind for number of cells per full crypt. Three animals of each genotype/treatment were analysed and 150 crypts were counted in total. Only intact crypts with a clear cross-section through the lumen were counted. Data are presented as the frequency with which a given number of cells/crypt is represented amongst the crypts counted. The mean frequency for each genotype/treatment is shown.
Increased expression of proliferation markers. Sections of Cre and VE-expressing crypts at 3 days p.i. were subjected to immunohistochemical analysis with antibodies for phospho-ERK (P-ERK), Ki67, phospho-histone H3 (P-H3) or BrdU (2 h labelling in vivo). Sections were counterstained with haematoxylin. Data presented are representative of three different mice of each genotype. Bars = 10 µm.
Electron microscopy of WT crypt and VE-expressing crypt at 3 days p.i. showing presence of mitotic cells (black arrows) only in the VE sample. Bars = 10 µm.
V600EBraf expression induces increased number of cells/villi at 1 week p.i. H&E-stained ‘swiss’ rolls of section 1 (ileum) were scored blind for number of cells per full villus and 150 villi were counted in total from three mice of each genotype. Data are presented as the frequency with which a given number of cells/villus is represented amongst the villi counted. The mean frequency for each genotype is shown.
V600EBraf induced epithelium serrations at 1 week p.i. H&E stained sections of VE sample at 1 week p.i. and Cre control are shown. Bars = 10 µm
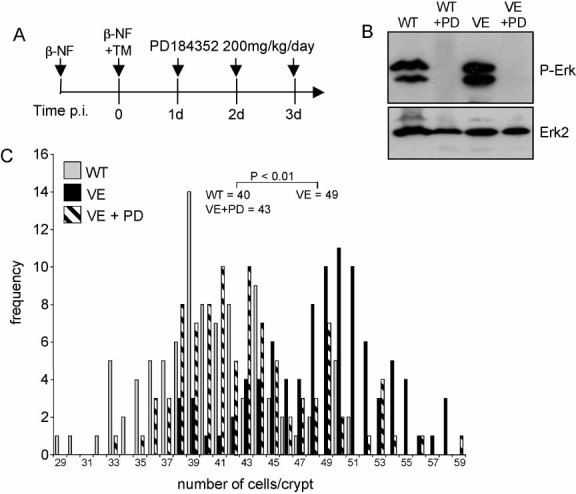
Treatment regime. Braf+/LSL-V600E; AhcreERT+/o were treated with β-NF followed by β-NF + TM 24 h later. At 1, 2 and 3 days p.i., half of the induced mice were administered with 200 mg/kg PD184352 by intraperitoneal injection. Mice were sacrificed 6 h after the last injection. WT mice were also subjected to the same dose of PD184352 for 3 days.
Erk phosphorylation is inhibited by PD184352. Protein lysates were prepared from the small intestine of all mice and subjected to Western blot analysis with an antibody for phospho-Erk. Erk2 was used as a loading control.
PD184352 reverses crypt hyperplasia. H&E-stained ‘swiss’ rolls of section 1 (ileum) were scored blind for number of cells per full crypt. Ninety-four crypts from three VE animals ± PD184352 and three WT animals without PD184352 were counted. Fifty crypts from WT animals + PD184352 were also counted but did not give an altered distribution compared to WT animals without treatment (data not shown). Data are presented as the frequency with which a given number of cells/crypt is represented amongst the crypts counted. The mean frequency for each genotype/treatment is shown.
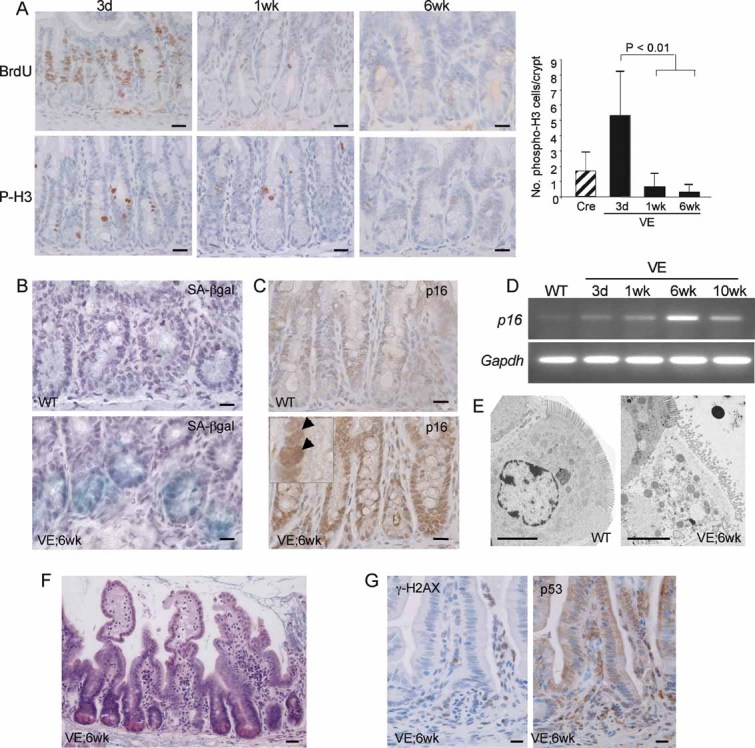
Reduced expression of proliferation markers. Sections of the ileum from VE-expressing crypts at 3 days, 1 week and 6 weeks p.i. were stained with antibodies for BrdU and phospho-histone H3 (P-H3) and counterstained with haematoxylin. The bar chart on the right represents the mean number of phospho-histone H3 positive cells/crypt ± SD from 100 full crypts counted from at least two mice of each genotype/treatment. Bars = 10 µm.
Expression of SA-β-galactosidase in WT and VE-expressing small intestine at 6 weeks p.i. Bars = 10 µm.
Increased expression of p16Ink4a protein. Sections of the ileum from WT or VE-expressing crypts at 6 weeks p.i. were stained with an antibody for p16Ink4a and counterstained with haematoxylin. An expanded view showing strong nuclear p16Ink4a staining in the VE sample is shown as an inset. Bars = 10 µm.
p16Ink4a and Gapdh mRNA expression in WT or VE-expressing small intestine at 3 days, 1 week, 6 weeks and 10 weeks p.i.
Electron microscopy showing the presence of a sessile, senescent enterocyte in the villi of VE-expressing small intestine at 6 weeks p.i. and a normal enterocyte in the WT control. Bars = 5 µm.
H&E staining of VE-expressing intestine at 6 weeks p.i. showing crypt loss and epithelial disintegration in parts of the small intestine at this stage. Bar = 20 µm.
Increased expression of phosphorylated γH2AX and nuclear p53 in areas of epithelial breakdown. Parallel sections of the ileum from VE-expressing sample at 6 weeks p.i. were stained with antibodies for γH2AX phosphorylation (left) or p53 (right) and counterstained with haematoxylin. Bars = 10 µm.
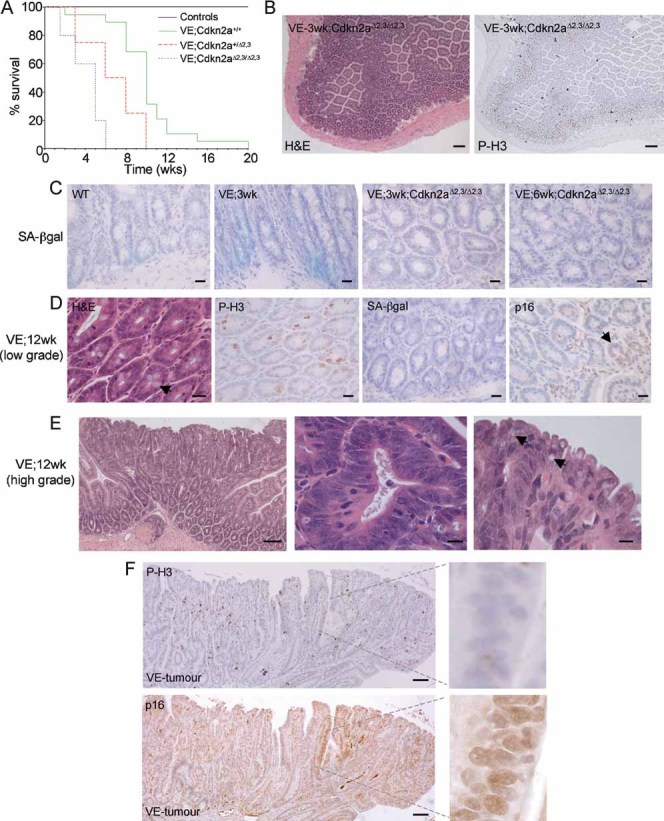
Kaplan–Meier plots showing survival of mice used in this study. The β-NF/TM-treated Braf+/LSL-V600E; AhcreERT+/o; Cdkn2a+/+ (VE;Cdkn2a+/+) group contained 22 animals, the β-NF/TM-treated Braf+/LSL-V600E; AhcreERT+/o; Cdkn2a+/Δ2,3 (VE;Cdkn2a+/Δ2,3) group contained 9 animals and the β-NF/TM-treated Braf+/LSL-V600E; AhcreERT+/o; Cdkn2aΔ2,3/Δ2,3 (VE;Cdkn2aΔ2,3/Δ2,3) group contained 9 animals. Controls included β-NF/TM-treated Braf+/LSL-V600E; AhcreERTo/o; Cdkn2a+/+ (4 mice), Braf+/+; AhcreERT+/o; Cdkn2a+/+ (5 mice), Braf+/+; AhcreERT+/o; Cdkn2a+/Δ2,3 (3 mice), Braf+/+; AhcreERT+/o; Cdkn2aΔ2,3/Δ2,3 (3 mice) and uninduced Braf+/+; AhcreERTo/o; Cdkn2a+/+ (>100 mice).
H&E staining (left panel) and immunostaining with phospho-histone H3 (right panel) of small intestine from β-NF/TM-treated Braf+/LSL-V600E; AhcreERT+/o; Cdkn2aΔ2,3/Δ2,3 mice at 3 weeks p.i. indicating areas of sustained epithelial proliferation. Bar = 100 µm.
SA-β-galactosidase staining of intestine from WT, β-NF/TM-treated Braf+/LSL-V600E; AhcreERT+/o mice at 3 weeks p.i. and β-NF/TM-treated Braf+/LSL-V600E; AhcreERT+/o; Cdkn2aΔ2,3/Δ2,3 mice at 3 weeks and 6 weeks p.i. Sections were counterstained with haematoxylin. Bars = 10 µm.
Low-grade adenomatous lesions from β-NF/TM-treated Braf+/LSL-V600E; AhcreERT+/o mice at 12 weeks p.i. H&E staining is indicated on the left panel showing preponderance of goblet cells (arrow). Phospho-histone H3 and SA-β-galactosidase staining show increased proliferation and lack of senescence. p16Ink4a staining (right panel) indicates growth of p16Ink4a negative cells next to an area of high p16Ink4a staining (arrow). Sections were counterstained with haematoxylin. Bars = 12.5 µm.
H&E staining of tumour from small intestine of Braf+/LSL-V600E; AhcreERT+/o mouse at 12 weeks p.i. showing low- and high-grade areas (left panel), serrated crypts with large, ovoid, fragmented nuclei (middle panel) and tufted tumour borders containing cells with accumulated mucin (arrows in right panel). Bars = 50 µm (left panel), 5 µm (middle and right panels).
Immunostaining of tumour with phospho-histone H3 (top panel) or p16Ink4a (bottom panel). Circumscribed areas stain strongly for p16Ink4a but weakly for phospho-histone H3. The right panels represent higher magnifications of these areas. Bars = 50 µm.
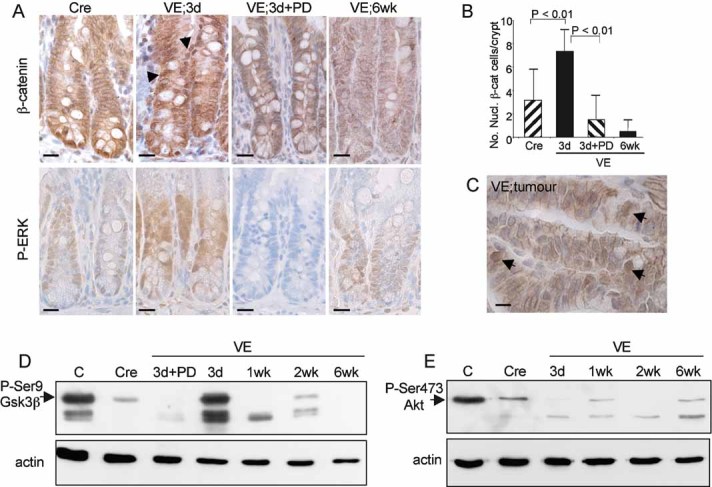
Immunostaining of Cre control or VE-expressing gut samples at 3 days and 6 weeks p.i. as well as a 3 day sample treated with PD184352 with an antibody for β-catenin (top panels) or phospho-Erk (bottom panels). Sections were counterstained with haematoxylin. Nuclear β-catenin staining is indicated by black arrows. Bars = 10 µm.
Quantitation of nuclear β-catenin positive cells. The bar chart represents the mean number of nuclear β-catenin positive cells/crypt ± SD from 100 full crypts counted from at least two mice of each genotype/treatment.
Immunostaining of tumour with antibody for β-catenin. Arrows indicate cells with high levels of nuclear β-catenin. Bar = 5 µm.
Western blot analysis of phosphorylation of Ser9 of Gsk3β in a control mouse embryonic fibroblast (MEF) sample (C), a Cre control gut sample and VE-expressing gut samples at 3 days–6 weeks p.i. The VE samples at 3 days p.i. treated ± PD184352 are the same as those analysed for phospho-Erk in Fig 3B.
Western blot analysis of phosphorylation of Ser473 of Akt in a control MEF sample (C), a Cre control gut sample and VE-expressing gut samples at 3 days–6 weeks p.i.
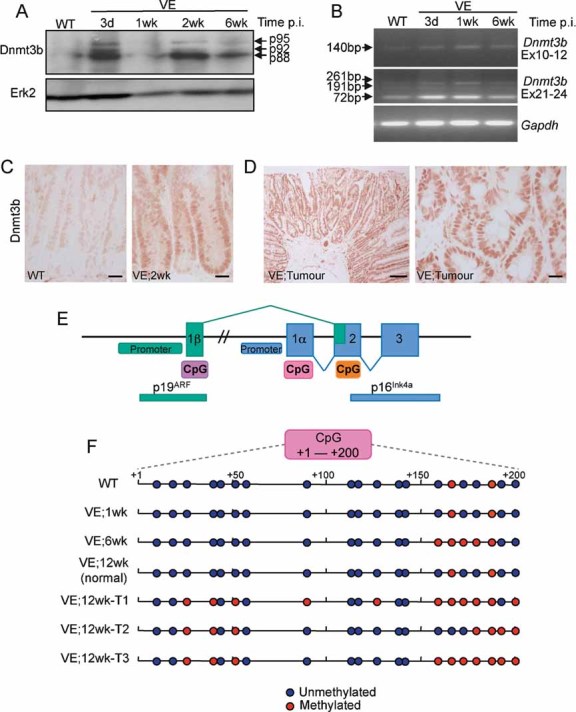
Dnmt3b protein expression. Protein lysates were subjected to Western blot analysis with an antibody for Dnmt3b. Erk2 was used as a loading control.
Dnmt3b mRNA expression using reverse transcription polymerase chain reaction (RT-PCR). Amplification across exons 10–12 of Dnmt3b generated a product of 140 bp indicating the lack of exon11 in all mRNA species. Exons 21–24 amplification generated a major species at 72 bp (Δexons 22/23) with minor species at 261 bp (+exons 22/23) and 191 bp (+exon 23/Δexon 22). Thus, the predominant species expressed in the mouse gut lacks exons 11, 22 and 23 and this isoform, along with the minor isoforms, are expressed at higher levels in the VE-expressing gut. Gapdh amplification was used as a control.
Immunostaining of WT control and VE-expressing gut samples at 2 weeks p.i. with an antibody for Dnmt3b. Bars = 10 µm.
Immunostaining of tumour from VE-expressing gut at 12 weeks p.i. with an antibody for Dnmt3b. Bars = 50 µm (left) and 10 µm (right).
Diagram illustrating the organization of the mouse Cdkn2a locus. CpG islands predicted by the EMBOSS programme are shown.
Bisulphite/sequencing analysis of p16 CpG island at +1 to +200 (with respect to the p16 transcription start site). DNA from WT and VE-expressing gut samples at 1 and 6 weeks p.i. were analysed together with DNA from three tumours (T1–T3) arising from VE-expressing gut at 12 weeks p.i. and a normal region of the gut from the same mouse.
References
-
- Aitken J, Welch J, Duffy D, Milligan A, Green A, Martin N, Hayward N. CDKN2A variants in a population-based sample of Queensland families with melanoma. J Natl Cancer Inst. 1999;91:446–452. - PubMed
-
- Amini Nik S, Hohenstein P, Jadidizadeh A, Van Dam K, Bastidas A, Berry RL, Patek CE, Van der Schueren B, Cassiman JJ, Tejpar S. Upregulation of Wilms’ tumor gene 1 (WT1) in desmoid tumors. Int J Cancer. 2005;114:202–208. - PubMed
Publication types
MeSH terms
Substances
Grants and funding
LinkOut - more resources
Full Text Sources
Medical
Molecular Biology Databases
Research Materials
Miscellaneous
