Randomized Controlled Trial
. 2010 Nov 15;202(10):1529-37.
doi: 10.1086/656718. Epub 2010 Oct 13.

A randomized factorial trial comparing 4 treatment regimens in treatment-naive HIV-infected persons with AIDS and/or a CD4 cell count <200 cells/μL in South Africa

Collaborators
Randomized Controlled Trial

A randomized factorial trial comparing 4 treatment regimens in treatment-naive HIV-infected persons with AIDS and/or a CD4 cell count <200 cells/μL in South Africa

Phidisa II Writing Team for Project Phidisa et al. J Infect Dis. .

Abstract

Background: Few randomized trials comparing antiretroviral therapy (ART) regimens have been conducted in resource-limited settings.

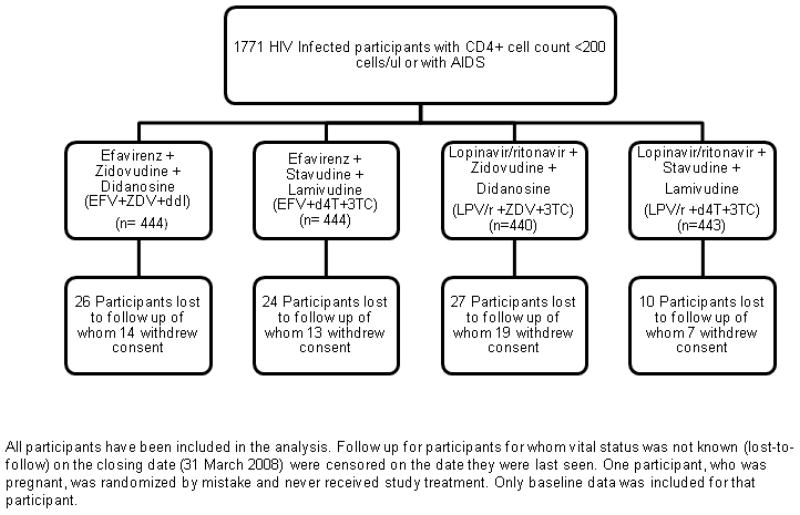
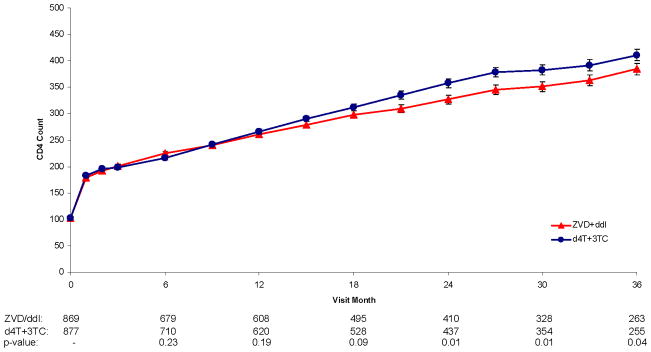
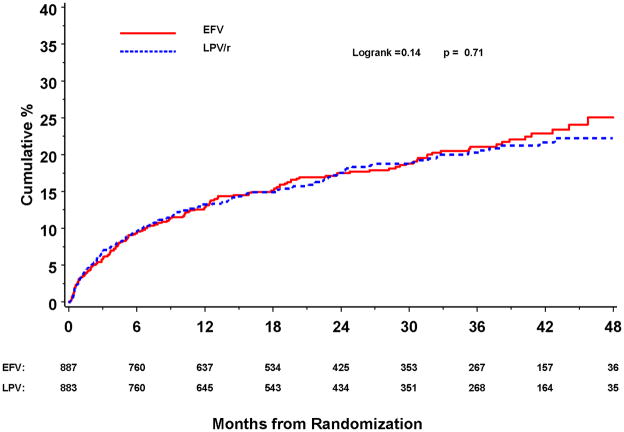
Methods: In the Republic of South Africa, antiretroviral-naive human immunodeficiency virus (HIV)-infected individuals >14 years old with a CD4 cell count <200 cells/μL or a prior AIDS diagnosis were randomized to receive efavirenz (EFV) or lopinavir/ritonavir (LPV/r) with either zidovudine (ZDV) plus didanosine (ddI) or stavudine (d4T) plus lamivudine (3TC) in an open-label, 2-by-2 factorial study and followed up for the primary outcome of AIDS or death and prespecified secondary outcomes, including CD4 cell count and viral load changes, treatment discontinuation, and grade 4 events.

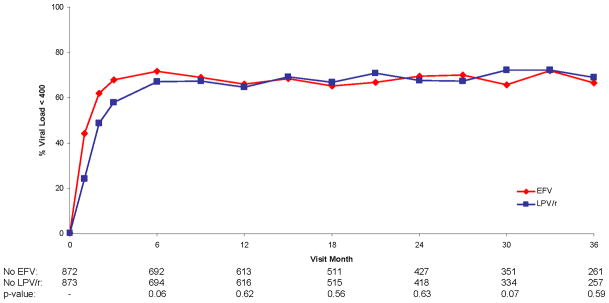
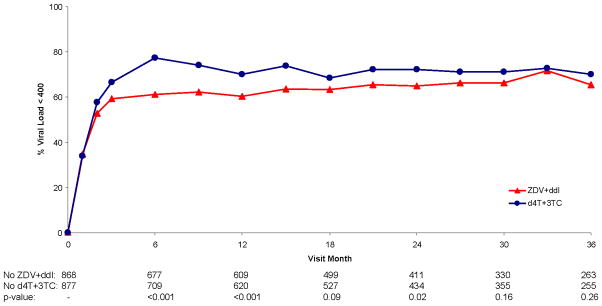
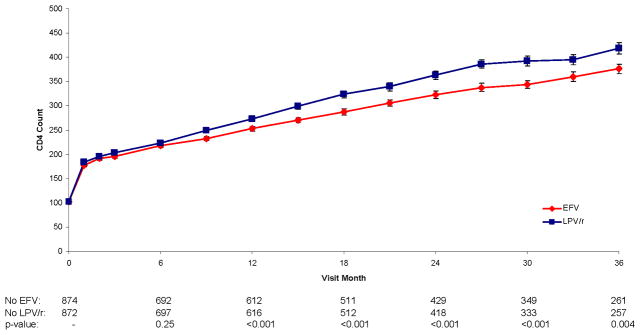
Results: In total, 1771 persons were randomized and followed up for a median of 24.7 months. AIDS or death occurred in (1) 163 participants assigned EFV and 157 assigned LPV/r (hazard ratio [HR], 1.04 [95% confidence interval {CI}, 0.84-1.30]) and in (2) 170 participants assigned ZDV+ddI and 150 assigned d4T+3TC (HR, 1.15 [95% CI, 0.93-1.44]). HIV RNA levels were lower (P < .001) and CD4 cell counts were greater (P < .01) over follow-up for d4T+3TC versus ZDV+ddI. Rates of potentially life-threatening adverse events and overall treatment discontinuation were similar for d4T+3TC and ZDV+ddI; however, more participants discontinued d4T because of toxicity (12.6%) than other treatments (<5%).

Conclusion: EFV and LPV/r are effective components of first-line ART. The poorer viral and immune responses with ZDV+ddI and the greater toxicity-associated discontinuation rate with d4T+3TC suggest that these treatments be used cautiously as initial therapy.

Trial registration: ClinicalTrials.gov identifier: NCT00342355.


Conflict of interest statement

Sean Emery has received grant support, travel awards and honoriums from Abbott, Boehnringer-Ingleheim, Bristol Myers Squibb, Gilead Sciences, GlaxoSmithKline, Merck, and Tibotec. All other authors do not have a commercial or other association that may pose a conflict of interest.

Figures

Figure 1
Figure 1
Randomization and follow-up of subjects on study Phidisa II study design.
Figure 2
Figure 2
Cumulative percent of subjects with HIV viral loads <400 copies/mL for EFV vs. LPV/r (2a) and for ZDV + ddI vs. d4T + 3TC (2b). CD4+ lymphocyte cell counts/mm3 for EFV vs. LPV/r (2c) and for ZDV + ddI vs. d4T + 3TC (2d) The numbers below the x-axis represent the numbers of subjects in each group at each time point. Figure 2a. Percent Viral Load < 400 Over Follow-up for Efavirenz vs. Lopinavir/Ritonavir Figure 2b. Percent Viral Load < 400 Over Follow-up for Zidovudine + Didanosine vs. Stavudine + Lamivudine Figure 2c. CD4 Count Over Follow-up for Efavirenz vs. Lopinavir/Ritonavir Figure 2d. CD4 Count Over Follow-up for Zidovudine + Didanosine vs. Stavudine + Lamivudine
Figure 2
Figure 2
Cumulative percent of subjects with HIV viral loads <400 copies/mL for EFV vs. LPV/r (2a) and for ZDV + ddI vs. d4T + 3TC (2b). CD4+ lymphocyte cell counts/mm3 for EFV vs. LPV/r (2c) and for ZDV + ddI vs. d4T + 3TC (2d) The numbers below the x-axis represent the numbers of subjects in each group at each time point. Figure 2a. Percent Viral Load < 400 Over Follow-up for Efavirenz vs. Lopinavir/Ritonavir Figure 2b. Percent Viral Load < 400 Over Follow-up for Zidovudine + Didanosine vs. Stavudine + Lamivudine Figure 2c. CD4 Count Over Follow-up for Efavirenz vs. Lopinavir/Ritonavir Figure 2d. CD4 Count Over Follow-up for Zidovudine + Didanosine vs. Stavudine + Lamivudine
Figure 3
Figure 3
Kaplan-Meier curves for death or progression of disease for EFV vs. LPV/r (3a), death for EFV vs. LPV/r (3b), death or progression of disease for ZDV + ddI vs. d4T + 3TC (3c), and death for ZDV + ddI vs. d4T + 3TC (3d). Figure 3a. KM Curve for Death or Progression of Disease for Efavirenz Versus Lopinavir/Ritonavir Figure 3b. KM Curve for Death for Efavirenz Versus Lopinavir/Ritonavir Figure 3c. KM Curve for Death or Progression of Disease for Zidovudine + Didanosine Versus Stavudine +Lamivudine Figure 3d. KM Curve for Death for Zidovudine + Didanosine Versus Stavudine +Lamivudine
Figure 3
Figure 3
Kaplan-Meier curves for death or progression of disease for EFV vs. LPV/r (3a), death for EFV vs. LPV/r (3b), death or progression of disease for ZDV + ddI vs. d4T + 3TC (3c), and death for ZDV + ddI vs. d4T + 3TC (3d). Figure 3a. KM Curve for Death or Progression of Disease for Efavirenz Versus Lopinavir/Ritonavir Figure 3b. KM Curve for Death for Efavirenz Versus Lopinavir/Ritonavir Figure 3c. KM Curve for Death or Progression of Disease for Zidovudine + Didanosine Versus Stavudine +Lamivudine Figure 3d. KM Curve for Death for Zidovudine + Didanosine Versus Stavudine +Lamivudine

Comment in

References

    1. Joint United Nations Programme on HIV/AIDS., NetLibrary Inc. 2006 report on the global AIDS epidemic. Geneva: UNAIDS; 2006. A UNAIDS 10th anniversary special ed.
    1. United States. Dept. of Health and Human Services., National Institutes of Health (U.S.). Office of AIDS Research. Advisory Council. Guidelines for the use of antiretroviral agents in HIV-1-infected adults and adolescents: November 3, 2008. Washington, D.C: Dept. of Health and Human Services; 2008.
    1. Karim SS, Churchyard GJ, Karim QA, Lawn SD. HIV infection and tuberculosis in South Africa: an urgent need to escalate the public health response. Lancet. 2009;374:921–933. - PMC - PubMed
    1. Health SANDo. National Antiretroviral Treatment Guidelines. Johannesburg: Jacana; 2004.
    1. Joint United Nations Programme on HIV/AIDS., World Health Organization. Progress on global access to HIV antiretroviral therapy a report on “3 by 5”, June 2005 and beyond. Geneva: World Health Organization: UNAIDS; 2006.

Publication types

MeSH terms

Associated data