

Possible role of aerosol transmission in a hospital outbreak of influenza
- PMID: 20942655
- PMCID: PMC7107804
- DOI: 10.1086/656743
Possible role of aerosol transmission in a hospital outbreak of influenza
Abstract
Background: We examined the role of aerosol transmission of influenza in an acute ward setting.
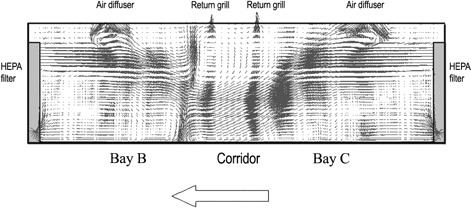
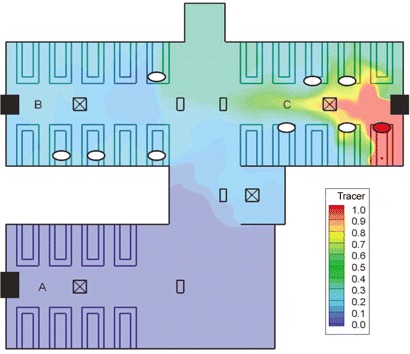
Methods: We investigated a seasonal influenza A outbreak that occurred in our general medical ward (with open bay ward layout) in 2008. Clinical and epidemiological information was collected in real time during the outbreak. Spatiotemporal analysis was performed to estimate the infection risk among patients. Airflow measurements were conducted, and concentrations of hypothetical virus-laden aerosols at different ward locations were estimated using computational fluid dynamics modeling.
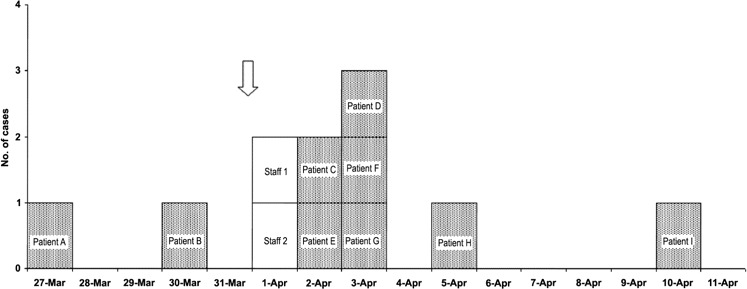
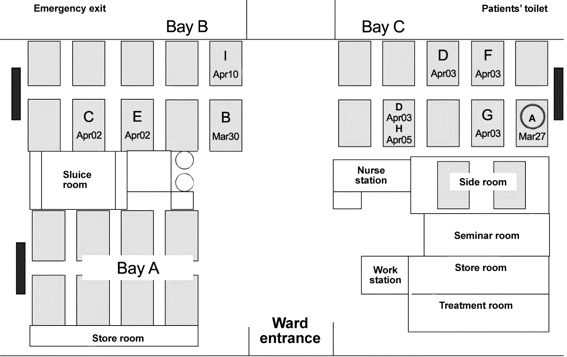
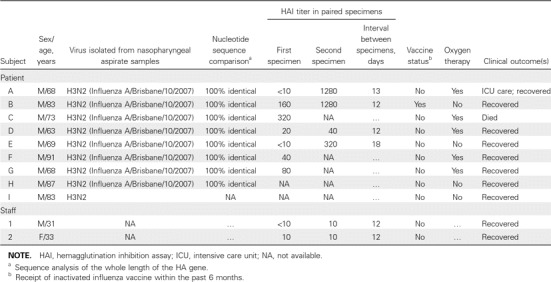
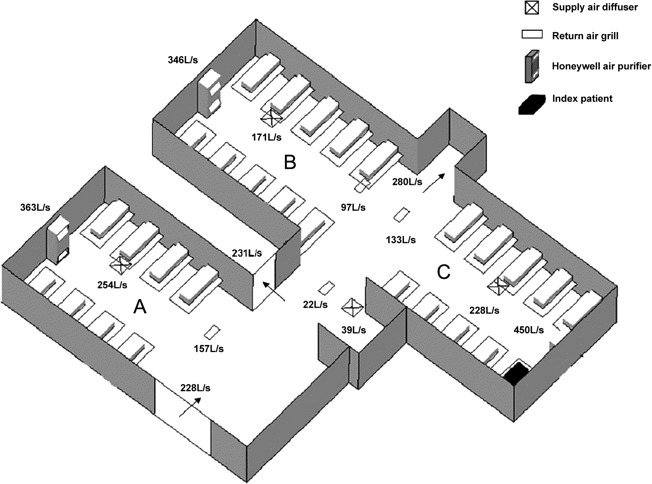
Results: Nine inpatients were infected with an identical strain of influenza A/H3N2 virus. With reference to the index patient's location, the attack rate was 20.0% and 22.2% in the "same" and "adjacent" bays, respectively, but 0% in the "distant" bay (P = .04). Temporally, the risk of being infected was highest on the day when noninvasive ventilation was used in the index patient; multivariate logistic regression revealed an odds ratio of 14.9 (95% confidence interval, 1.7-131.3; P = .015). A simultaneous, directional indoor airflow blown from the "same" bay toward the "adjacent" bay was found; it was inadvertently created by an unopposed air jet from a separate air purifier placed next to the index patient's bed. Computational fluid dynamics modeling revealed that the dispersal pattern of aerosols originated from the index patient coincided with the bed locations of affected patients.
Conclusions: Our findings suggest a possible role of aerosol transmission of influenza in an acute ward setting. Source and engineering controls, such as avoiding aerosol generation and improving ventilation design, may warrant consideration to prevent nosocomial outbreaks.
Figures
Similar articles
-
Routes of transmission during a nosocomial influenza A(H3N2) outbreak among geriatric patients and healthcare workers.J Hosp Infect. 2014 Mar;86(3):188-93. doi: 10.1016/j.jhin.2013.11.009. Epub 2014 Jan 8. J Hosp Infect. 2014. PMID: 24468292
-
A "pre-seasonal" hospital outbreak of influenza pneumonia caused by the drift variant A/Victoria/361/2011-like H3N2 viruses, Hong Kong, 2011.J Clin Virol. 2013 Mar;56(3):219-25. doi: 10.1016/j.jcv.2012.11.002. Epub 2012 Nov 30. J Clin Virol. 2013. PMID: 23201458
-
Role of air distribution in SARS transmission during the largest nosocomial outbreak in Hong Kong.Indoor Air. 2005 Apr;15(2):83-95. doi: 10.1111/j.1600-0668.2004.00317.x. Indoor Air. 2005. PMID: 15737151
-
Observing and quantifying airflows in the infection control of aerosol- and airborne-transmitted diseases: an overview of approaches.J Hosp Infect. 2011 Mar;77(3):213-22. doi: 10.1016/j.jhin.2010.09.037. Epub 2010 Dec 30. J Hosp Infect. 2011. PMID: 21194796 Free PMC article. Review.
-
Factors involved in the aerosol transmission of infection and control of ventilation in healthcare premises.J Hosp Infect. 2006 Oct;64(2):100-14. doi: 10.1016/j.jhin.2006.05.022. Epub 2006 Aug 17. J Hosp Infect. 2006. PMID: 16916564 Free PMC article. Review.
Cited by
-
Influenza a outbreak in an ambulatory stem cell transplant center.Open Forum Infect Dis. 2014 Aug 7;1(2):ofu050. doi: 10.1093/ofid/ofu050. eCollection 2014 Sep. Open Forum Infect Dis. 2014. PMID: 25734122 Free PMC article.
-
Modelling the Impact of Robotics on Infectious Spread Among Healthcare Workers.Front Robot AI. 2021 May 25;8:652685. doi: 10.3389/frobt.2021.652685. eCollection 2021. Front Robot AI. 2021. PMID: 34113657 Free PMC article.
-
Modeling the impact of indoor relative humidity on the infection risk of five respiratory airborne viruses.Sci Rep. 2022 Jul 7;12(1):11481. doi: 10.1038/s41598-022-15703-8. Sci Rep. 2022. PMID: 35798789 Free PMC article.
-
A Narrative Review of Influenza: A Seasonal and Pandemic Disease.Iran J Med Sci. 2017 Jan;42(1):2-13. Iran J Med Sci. 2017. PMID: 28293045 Free PMC article. Review.
-
Spatial dynamics of airborne infectious diseases.J Theor Biol. 2012 Mar 21;297:116-26. doi: 10.1016/j.jtbi.2011.12.015. Epub 2011 Dec 23. J Theor Biol. 2012. PMID: 22207025 Free PMC article.
References
-
- Voirin N, Barret B, Metzger MH, Vanhems P. Hospital-acquired influenza: a synthesis using the Outbreak Reports and Intervention Studies of Nosocomial Infection (ORION) statement. J Hosp Infect. 2009;71(1):1–14. - PubMed
-
- Salgado CD, Farr BM, Hall KK, Hayden FG. Influenza in the acute hospital setting. Lancet Infect Dis. 2002;2:145–155. - PubMed
-
- Bridges CB, Kuehnert MJ, Hall CB. Transmission of influenza:implications for control in health care settings. Clin Infect Dis. 2003;37:1094–1101. - PubMed
-
- Sartor C, Zandotti C, Romain F, et al. Disruption of services in an internal medicine unit due to a nosocomial influenza outbreak. Infect Control Hosp Epidemiol. 2002;23(10):615–619. - PubMed
-
- Ng TC, Lee N, Hui SC, Lai R, Ip M. Preventing healthcare workers from acquiring influenza. Infect Control Hosp Epidemiol. 2009;30(3):292–295. - PubMed
MeSH terms
Substances
LinkOut - more resources
Full Text Sources
Medical
