

Functional analysis: evaluation of response intensities--tailoring ANOVA for lists of expression subsets
- PMID: 20942918
- PMCID: PMC2964684
- DOI: 10.1186/1471-2105-11-510
Functional analysis: evaluation of response intensities--tailoring ANOVA for lists of expression subsets
Abstract
Background: Microarray data is frequently used to characterize the expression profile of a whole genome and to compare the characteristics of that genome under several conditions. Geneset analysis methods have been described previously to analyze the expression values of several genes related by known biological criteria (metabolic pathway, pathology signature, co-regulation by a common factor, etc.) at the same time and the cost of these methods allows for the use of more values to help discover the underlying biological mechanisms.
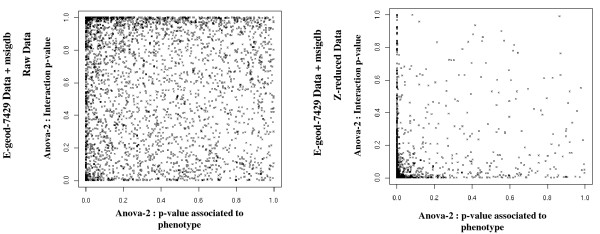
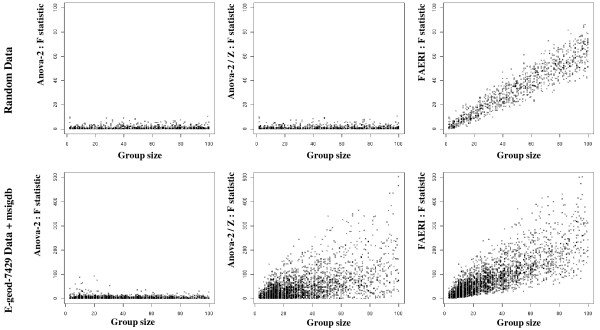
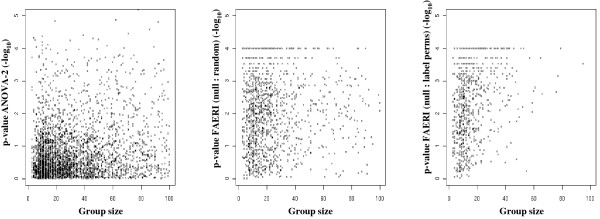
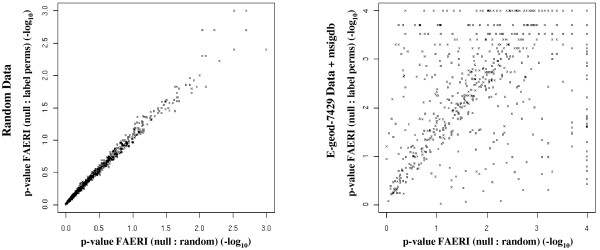
Results: As several methods assume different null hypotheses, we propose to reformulate the main question that biologists seek to answer. To determine which genesets are associated with expression values that differ between two experiments, we focused on three ad hoc criteria: expression levels, the direction of individual gene expression changes (up or down regulation), and correlations between genes. We introduce the FAERI methodology, tailored from a two-way ANOVA to examine these criteria. The significance of the results was evaluated according to the self-contained null hypothesis, using label sampling or by inferring the null distribution from normally distributed random data. Evaluations performed on simulated data revealed that FAERI outperforms currently available methods for each type of set tested. We then applied the FAERI method to analyze three real-world datasets on hypoxia response. FAERI was able to detect more genesets than other methodologies, and the genesets selected were coherent with current knowledge of cellular response to hypoxia. Moreover, the genesets selected by FAERI were confirmed when the analysis was repeated on two additional related datasets.
Conclusions: The expression values of genesets are associated with several biological effects. The underlying mathematical structure of the genesets allows for analysis of data from several genes at the same time. Focusing on expression levels, the direction of the expression changes, and correlations, we showed that two-step data reduction allowed us to significantly improve the performance of geneset analysis using a modified two-way ANOVA procedure, and to detect genesets that current methods fail to detect.
Figures
Similar articles
-
Modelling p-value distributions to improve theme-driven survival analysis of cancer transcriptome datasets.BMC Bioinformatics. 2010 Jan 11;11:19. doi: 10.1186/1471-2105-11-19. BMC Bioinformatics. 2010. PMID: 20064243 Free PMC article.
-
Post hoc pattern matching: assigning significance to statistically defined expression patterns in single channel microarray data.BMC Bioinformatics. 2007 Jul 5;8:240. doi: 10.1186/1471-2105-8-240. BMC Bioinformatics. 2007. PMID: 17615071 Free PMC article.
-
Group testing for pathway analysis improves comparability of different microarray datasets.Bioinformatics. 2006 Oct 15;22(20):2500-6. doi: 10.1093/bioinformatics/btl424. Epub 2006 Aug 7. Bioinformatics. 2006. PMID: 16895928
-
ARSyN: a method for the identification and removal of systematic noise in multifactorial time course microarray experiments.Biostatistics. 2012 Jul;13(3):553-66. doi: 10.1093/biostatistics/kxr042. Epub 2011 Nov 14. Biostatistics. 2012. PMID: 22085896
-
Using ANOVA to analyze microarray data.Biotechniques. 2004 Aug;37(2):173-5, 177. doi: 10.2144/04372TE01. Biotechniques. 2004. PMID: 15335204 Review.
Cited by
-
Proteome expression and carbonylation changes during Trypanosoma cruzi infection and Chagas disease in rats.Mol Cell Proteomics. 2012 Apr;11(4):M111.010918. doi: 10.1074/mcp.M111.010918. Epub 2011 Dec 22. Mol Cell Proteomics. 2012. PMID: 22199233 Free PMC article.
-
Meta-analysis and gene set analysis of archived microarrays suggest implication of the spliceosome in metastatic and hypoxic phenotypes.PLoS One. 2014 Jan 31;9(1):e86699. doi: 10.1371/journal.pone.0086699. eCollection 2014. PLoS One. 2014. PMID: 24497970 Free PMC article.
-
Adaptation of a Bioinformatics Microarray Analysis Workflow for a Toxicogenomic Study in Rainbow Trout.PLoS One. 2015 Jul 17;10(7):e0128598. doi: 10.1371/journal.pone.0128598. eCollection 2015. PLoS One. 2015. PMID: 26186543 Free PMC article.
-
Cardiac-oxidized antigens are targets of immune recognition by antibodies and potential molecular determinants in chagas disease pathogenesis.PLoS One. 2012;7(1):e28449. doi: 10.1371/journal.pone.0028449. Epub 2012 Jan 4. PLoS One. 2012. PMID: 22238578 Free PMC article.
-
Meta-Analysis of Microarray Data of Rainbow Trout Fry Gonad Differentiation Modulated by Ethynylestradiol.PLoS One. 2015 Sep 17;10(9):e0135799. doi: 10.1371/journal.pone.0135799. eCollection 2015. PLoS One. 2015. PMID: 26379055 Free PMC article.
References
Publication types
MeSH terms
LinkOut - more resources
Full Text Sources
Research Materials
