

Relative replication capacity of phenotypic SIV variants during primary infections differs with route of inoculation
- PMID: 20942954
- PMCID: PMC2964591
- DOI: 10.1186/1742-4690-7-88
Relative replication capacity of phenotypic SIV variants during primary infections differs with route of inoculation
Abstract
Background: Previous studies of human and simian immunodeficiency virus (HIV and SIV) have demonstrated that adaptive mutations selected during the course of infection alter viral replicative fitness, persistence, and pathogenicity. What is unclear from those studies is the impact of transmission on the replication and pathogenicity of the founding virus population. Using the SIV-macaque model, we examined whether the route of infection would affect the establishment and replication of two SIVmne variants of distinct in vitro and in vivo biological characteristics. For these studies, we performed dual-virus inoculations of pig-tailed macaques via intrarectal or intravenous routes with SIVmneCl8, a minimally pathogenic virus, and SIVmne027, a highly pathogenic variant that replicates more robustly in CD4+ T cells.
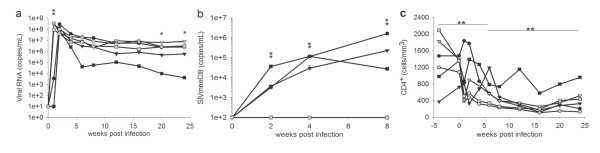
Results: The data demonstrate that SIVmne027 is the dominant virus regardless of the route of infection, indicating that the capacity to replicate efficiently in CD4+ T cells is important for fitness. Interestingly, in comparison to intravenous co-infection, intrarectal inoculation enabled greater relative replication of the less pathogenic virus, SIVmneCl8. Moreover, a higher level of SIVmneCl8 replication during primary infection of the intrarectally inoculated macaques was associated with lower overall plasma viral load and slower decline in CD4+ T cells, even though SIVmne027 eventually became the dominant virus.
Conclusions: These results suggest that the capacity to replicate in CD4+ T cells is a significant determinant of SIV fitness and pathogenicity. Furthermore, the data also suggest that mucosal transmission may support early replication of phenotypically diverse variants, while slowing the rate of CD4+ T cell decline during the initial stages of infection.
Figures
Similar articles
-
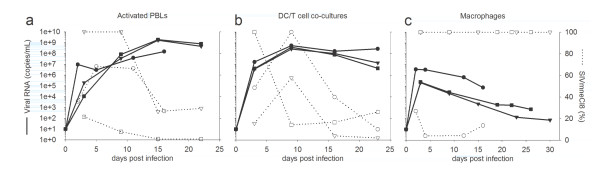
The increased replicative capacity of a late-stage simian immunodeficiency virus mne variant is evident in macrophage- or dendritic cell-T-cell cocultures.Virology. 2004 Oct 1;327(2):307-17. doi: 10.1016/j.virol.2004.07.010. Virology. 2004. PMID: 15351218
-
A lymph node-derived cytopathic simian immunodeficiency virus Mne variant replicates in nonstimulated peripheral blood mononuclear cells.J Virol. 1998 Jan;72(1):245-56. doi: 10.1128/JVI.72.1.245-256.1998. J Virol. 1998. PMID: 9420221 Free PMC article.
-
Changes in simian immunodeficiency virus reverse transcriptase alleles that appear during infection of macaques enhance infectivity and replication in CD4+ T cells.Virology. 2008 Jan 5;370(1):184-93. doi: 10.1016/j.virol.2007.08.011. Epub 2007 Sep 29. Virology. 2008. PMID: 17904609 Free PMC article.
-
Understanding the basis of CD4(+) T-cell depletion in macaques infected by a simian-human immunodeficiency virus.Vaccine. 2002 May 6;20(15):1934-7. doi: 10.1016/s0264-410x(02)00072-5. Vaccine. 2002. PMID: 11983249 Review.
-
On the relative fitness of early and late stage Simian immunodeficiency virus isolates.Theor Popul Biol. 2007 Nov;72(3):426-35. doi: 10.1016/j.tpb.2007.03.005. Epub 2007 Mar 21. Theor Popul Biol. 2007. PMID: 17499829 Free PMC article. Review.
Cited by
-
Repressive effect of primary virus replication on superinfection correlated with gut-derived central memory CD4(+) T cells in SHIV-infected Chinese rhesus macaques.PLoS One. 2013 Sep 2;8(9):e72295. doi: 10.1371/journal.pone.0072295. eCollection 2013. PLoS One. 2013. PMID: 24023734 Free PMC article.
-
Viral load Reduction in SHIV-Positive Nonhuman Primates via Long-Acting Subcutaneous Tenofovir Alafenamide Fumarate Release from a Nanofluidic Implant.Pharmaceutics. 2020 Oct 17;12(10):981. doi: 10.3390/pharmaceutics12100981. Pharmaceutics. 2020. PMID: 33080776 Free PMC article.
-
Clearance of HIV-1 or SIV reservoirs by promotion of apoptosis and inhibition of autophagy: Targeting intracellular molecules in cure-directed strategies.J Leukoc Biol. 2022 Nov;112(5):1245-1259. doi: 10.1002/JLB.4MR0222-606. Epub 2022 Mar 31. J Leukoc Biol. 2022. PMID: 35362118 Free PMC article. Review.
-
Infection of rhesus macaques with a pool of simian immunodeficiency virus with the envelope genes from acute HIV-1 infections.AIDS Res Ther. 2016 Nov 25;13(1):41. doi: 10.1186/s12981-016-0125-8. AIDS Res Ther. 2016. PMID: 27906032 Free PMC article.
-
Antiviral potency of long-acting islatravir subdermal implant in SHIV-infected macaques.J Control Release. 2024 Feb;366:18-27. doi: 10.1016/j.jconrel.2023.12.031. Epub 2023 Dec 29. J Control Release. 2024. PMID: 38142963 Free PMC article.
References
Publication types
MeSH terms
Grants and funding
LinkOut - more resources
Full Text Sources
Research Materials
