. 2011 May;21(5):1134-46.
doi: 10.1093/cercor/bhq190. Epub 2010 Oct 12.

Decreased interhemispheric functional connectivity in autism

Affiliations

Decreased interhemispheric functional connectivity in autism

Jeffrey S Anderson et al. Cereb Cortex. 2011 May.

Abstract

The cortical underconnectivity theory asserts that reduced long-range functional connectivity might contribute to a neural mechanism for autism. We examined resting-state blood oxygen level-dependent interhemispheric correlation in 53 males with high-functioning autism and 39 typically developing males from late childhood through early adulthood. By constructing spatial maps of correlation between homologous voxels in each hemisphere, we found significantly reduced interhemispheric correlation specific to regions with functional relevance to autism: sensorimotor cortex, anterior insula, fusiform gyrus, superior temporal gyrus, and superior parietal lobule. Observed interhemispheric connectivity differences were better explained by diagnosis of autism than by potentially confounding neuropsychological metrics of language, IQ, or handedness. Although both corpus callosal volume and gray matter interhemispheric connectivity were significantly reduced in autism, no direct relationship was observed between them, suggesting that structural and functional metrics measure different aspects of interhemispheric connectivity. In the control but not the autism sample, there was decreasing interhemispheric correlation with subject age. Greater differences in interhemispheric correlation were seen for more lateral regions in the brain. These findings suggest that long-range connectivity abnormalities in autism are spatially heterogeneous and that transcallosal connectivity is decreased most in regions with functions associated with behavioral abnormalities in autism. Autism subjects continue to show developmental differences in interhemispheric connectivity into early adulthood.


Figures

Figure 1.
Figure 1.
Calculating interhemispheric correlation. For each voxel in the image, a corresponding voxel in the opposite hemisphere was obtained by inverting the MNI x coordinate. Time series for each pair of voxels was obtained, and the value of the cross-correlogram at zero lag (Pearson correlation coefficient) was used to construct an image of interhemispheric correlation. This image was Fisher transformed by evaluating hyperbolic arctangent and then spatially smoothed.
Figure 2.
Figure 2.
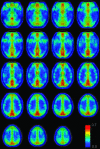
Interhemispheric correlation averaged over 39 control subjects. Scale bar shows Fisher-transformed correlation (Z-score).
Figure 3.
Figure 3.
Control > autism interhemispheric correlation. Regions of greater interhemispheric correlation for 39 controls than in 53 autism subjects. All clusters were significant at q < 0.001, false discovery rate. No voxels showed significantly greater interhemispheric correlation for autism than control subjects.
Figure 4.
Figure 4.
Increased interhemispheric correlation associated with younger age. All clusters were significant at q < 0.001, false discovery rate. No voxels showed significantly higher interhemispheric correlation with older age or higher or lower vIQ, pIQ, Edinburgh Handedness Inventory, ADOS, SRS, or CELF-3 scores.
Figure 5.
Figure 5.
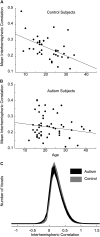
Relationship of mean gray matter interhemispheric correlation with subject age. (A) Each point represents mean gray matter interhemispheric correlation for 1 of 39 control subjects (above), with best straight line fit through the data. (B) The same is shown below for 53 autism subjects. (C) Distributions of interhemispheric correlation across gray matter voxels. Distributions were computed for each subject and shaded averages above show pointwise 95% confidence intervals for distributions from autism and control populations, computed on Fisher-transformed correlation.
Figure 6.
Figure 6.
Interhemispheric correlation does not vary with corpus callosal volume. Mean interhemispheric correlation of gray matter voxels is compared with corpus callosal volume from the MP-RAGE scan for each subject.
Figure 7.
Figure 7.
Differences in interhemispheric correlation increase with distance from the midline. The difference of mean interhemispheric correlation from gray matter voxels between control and autism subjects is shown for each sagittal slice. Error bars represent SD across voxels in the slice for difference in mean correlation between control and autism samples.
Figure 8.
Figure 8.
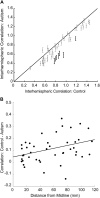
Effect of distance between regions on interhemispheric correlation. (A) The supratentorial brain was parcellated into 45 pairs of left/right homologous regions. Each point shows the mean interhemispheric correlation between left and right homologues for one region. Error bars show standard error of the mean across autism subjects. Dark bars were statistically significant after Bonferroni correction. (B) The same regions as above were used to plot the difference between control and autism mean interhemispheric correlation for each region against the Euclidean distance between the centroids of the left and right homologues for the region.

Similar articles

Cited by

References

    1. Alexander AL, Lee JE, Lazar M, Boudos R, DuBray MB, Oakes TR, Miller JN, Lu J, Jeong EK, McMahon WM, et al. Diffusion tensor imaging of the corpus callosum in Autism. Neuroimage. 2007;34:61–73. - PubMed
    1. American Psychiatric Association. Diagnostic and Statistical Manual of Mental Disorders: DSM-IV. 4th ed. Washington (DC): American Psychiatric Association; 1994.
    1. Anderson JS, Druzgal TJ, Lopez-Larson M, Jeong EK, Desai K, Yurgelun-Todd D. Network anticorrelations, global regression, and phase-shifted soft tissue correction. Hum Brain Mapp. 2010 Published Online 9 Jun 2010. - PMC - PubMed
    1. Anderson JS, Lange N, Froehlich A, DuBray M, Druzgal T, Froimowitz M, Alexander A, Bigler E, Lainhart J. Decreased left posterior insular activity during auditory language in autism. AJNR Am J Neuroradiol. 2010;31:131–139. - PMC - PubMed
    1. Bailey AJ, Braeutigam S, Jousmaki V, Swithenby SJ. Abnormal activation of face processing systems at early and intermediate latency in individuals with autism spectrum disorder: a magnetoencephalographic study. Eur J Neurosci. 2005;21:2575–2585. - PubMed

Publication types

MeSH terms