

Unravelling the structure of species extinction risk for predictive conservation science
- PMID: 20943690
- PMCID: PMC3061137
- DOI: 10.1098/rspb.2010.1877
Unravelling the structure of species extinction risk for predictive conservation science
Abstract
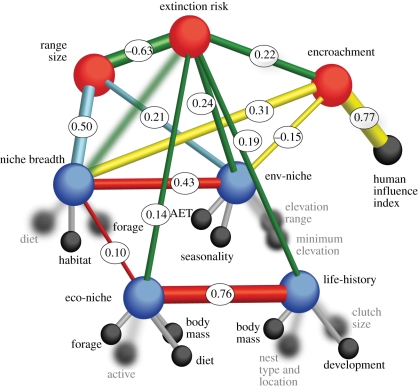
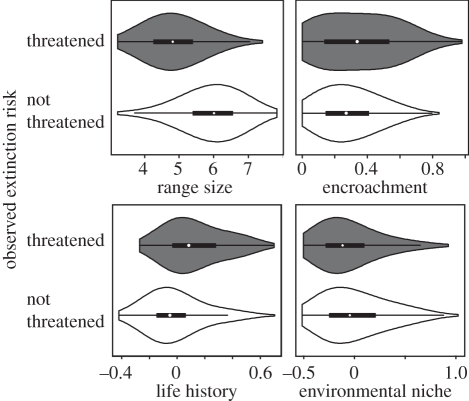
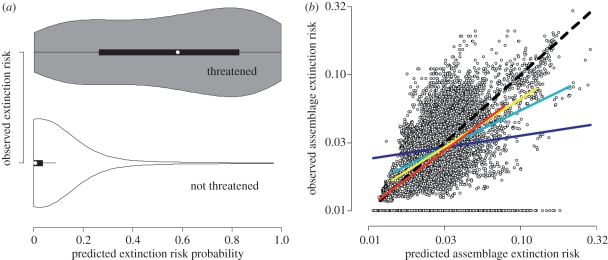
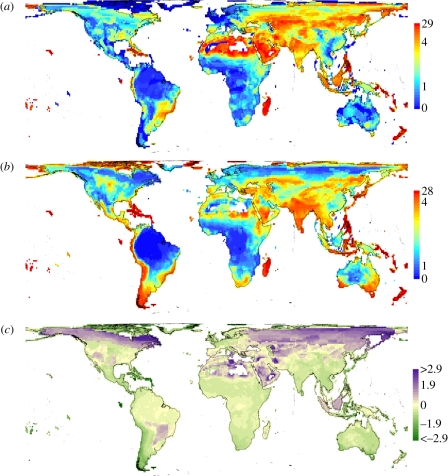
Extinction risk varies across species and space owing to the combined and interactive effects of ecology/life history and geography. For predictive conservation science to be effective, large datasets and integrative models that quantify the relative importance of potential factors and separate rapidly changing from relatively static threat drivers are urgently required. Here, we integrate and map in space the relative and joint effects of key correlates of The International Union for Conservation of Nature-assessed extinction risk for 8700 living birds. Extinction risk varies significantly with species' broad-scale environmental niche, geographical range size, and life-history and ecological traits such as body size, developmental mode, primary diet and foraging height. Even at this broad scale, simple quantifications of past human encroachment across species' ranges emerge as key in predicting extinction risk, supporting the use of land-cover change projections for estimating future threat in an integrative setting. A final joint model explains much of the interspecific variation in extinction risk and provides a remarkably strong prediction of its observed global geography. Our approach unravels the species-level structure underlying geographical gradients in extinction risk and offers a means of disentangling static from changing components of current and future threat. This reconciliation of intrinsic and extrinsic, and of past and future extinction risk factors may offer a critical step towards a more continuous, forward-looking assessment of species' threat status based on geographically explicit environmental change projections, potentially advancing global predictive conservation science.
Figures
Similar articles
-
Geography of current and future global mammal extinction risk.PLoS One. 2017 Nov 16;12(11):e0186934. doi: 10.1371/journal.pone.0186934. eCollection 2017. PLoS One. 2017. PMID: 29145486 Free PMC article.
-
Threat to the point: improving the value of comparative extinction risk analysis for conservation action.Glob Chang Biol. 2014 Feb;20(2):483-94. doi: 10.1111/gcb.12366. Epub 2013 Dec 25. Glob Chang Biol. 2014. PMID: 23966334
-
Prediction of extinction in plants: interaction of extrinsic threats and life history traits.Ecology. 2007 Oct;88(10):2662-72. doi: 10.1890/06-1453.1. Ecology. 2007. PMID: 18027768
-
The biodiversity of species and their rates of extinction, distribution, and protection.Science. 2014 May 30;344(6187):1246752. doi: 10.1126/science.1246752. Science. 2014. PMID: 24876501 Review.
-
A review of the relationships between human population density and biodiversity.Biol Rev Camb Philos Soc. 2007 Nov;82(4):607-45. doi: 10.1111/j.1469-185X.2007.00028.x. Biol Rev Camb Philos Soc. 2007. PMID: 17944620 Review.
Cited by
-
Phylogenetic and spatial distribution of evolutionary diversification, isolation, and threat in turtles and crocodilians (non-avian archosauromorphs).BMC Evol Biol. 2020 Jul 10;20(1):81. doi: 10.1186/s12862-020-01642-3. BMC Evol Biol. 2020. PMID: 32650718 Free PMC article.
-
Integrating behaviour and ecology into global biodiversity conservation strategies.Philos Trans R Soc Lond B Biol Sci. 2019 Sep 16;374(1781):20190012. doi: 10.1098/rstb.2019.0012. Epub 2019 Jul 29. Philos Trans R Soc Lond B Biol Sci. 2019. PMID: 31352893 Free PMC article.
-
Explaining the primate extinction crisis: predictors of extinction risk and active threats.Proc Biol Sci. 2023 Sep 13;290(2006):20231441. doi: 10.1098/rspb.2023.1441. Epub 2023 Sep 6. Proc Biol Sci. 2023. PMID: 37670584 Free PMC article.
-
Forest loss and the biodiversity threshold: an evaluation considering species habitat requirements and the use of matrix habitats.PLoS One. 2013 Dec 4;8(12):e82369. doi: 10.1371/journal.pone.0082369. eCollection 2013. PLoS One. 2013. PMID: 24324776 Free PMC article.
-
Integrating data-deficient species in analyses of evolutionary history loss.Ecol Evol. 2016 Nov 1;6(23):8502-8514. doi: 10.1002/ece3.2390. eCollection 2016 Dec. Ecol Evol. 2016. PMID: 28031802 Free PMC article.
References
-
- Purvis A., Gittleman J. L., Cowlishaw G., Mace G. M. 2000. Predicting extinction risk in declining species. Proc. R. Soc. Lond. B 267, 1947–195210.1098/rspb.2000.1234 (doi:10.1098/rspb.2000.1234) - DOI - DOI - PMC - PubMed
-
- Mace G. M., Collar N. J., Gaston K. J., Hilton-Taylor C., Akcakaya H. R., Leader-Williams N., Milner-Gulland E. J., Stuart S. N. 2008. Quantification of extinction risk: IUCN's system for classifying threatened species. Conserv. Biol. 22, 1424–144210.1111/j.1523-1739.2008.01044.x (doi:10.1111/j.1523-1739.2008.01044.x) - DOI - DOI - PubMed
-
- Bennett P. M., Owens I. P. F. 1997. Variation in extinction risk among birds: chance or evolutionary predisposition? Proc. R. Soc. Lond. B 264, 401–40810.1098/rspb.1997.0057 (doi:10.1098/rspb.1997.0057) - DOI - DOI
-
- Sodhi N. S., Bickford D., Diesmos A. C., Lee T. M., Koh L. P., Brook B. W., Sekercioglu C. H., Bradshaw C. J. A. 2008. Measuring the meltdown: drivers of global amphibian extinction and decline. PLoS ONE 3, e1636.10.1371/journal.pone.0001636 (doi:10.1371/journal.pone.0001636) - DOI - DOI - PMC - PubMed
-
- Cardillo M., Mace G. M., Jones K. E., Bielby J., Bininda-Emonds O. R. P., Sechrest W., Orme C. D. L., Purvis A. 2005. Multiple causes of high extinction risk in large mammal species. Science 309, 1239–124110.1126/science.1116030 (doi:10.1126/science.1116030) - DOI - DOI - PubMed
Publication types
MeSH terms
LinkOut - more resources
Full Text Sources
Miscellaneous
