

FTO is increased in muscle during type 2 diabetes, and its overexpression in myotubes alters insulin signaling, enhances lipogenesis and ROS production, and induces mitochondrial dysfunction
- PMID: 20943749
- PMCID: PMC3012179
- DOI: 10.2337/db10-0281
FTO is increased in muscle during type 2 diabetes, and its overexpression in myotubes alters insulin signaling, enhances lipogenesis and ROS production, and induces mitochondrial dysfunction
Abstract
Objective: A strong association between genetic variants and obesity was found for the fat mass and obesity-associated gene (FTO). However, few details are known concerning the expression and function of FTO in skeletal muscle of patients with metabolic diseases.
Research design and methods: We investigated basal FTO expression in skeletal muscle from obese nondiabetic subjects and type 1 and type 2 diabetic patients, compared with age-matched control subjects, and its regulation in vivo by insulin, glucose, or rosiglitazone. The function of FTO was further studied in myotubes by overexpression experiments.
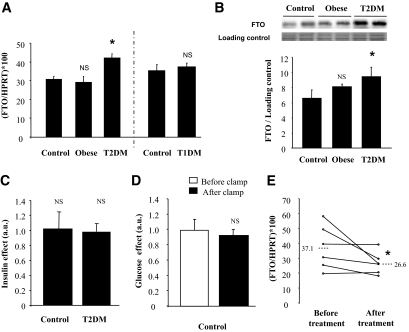
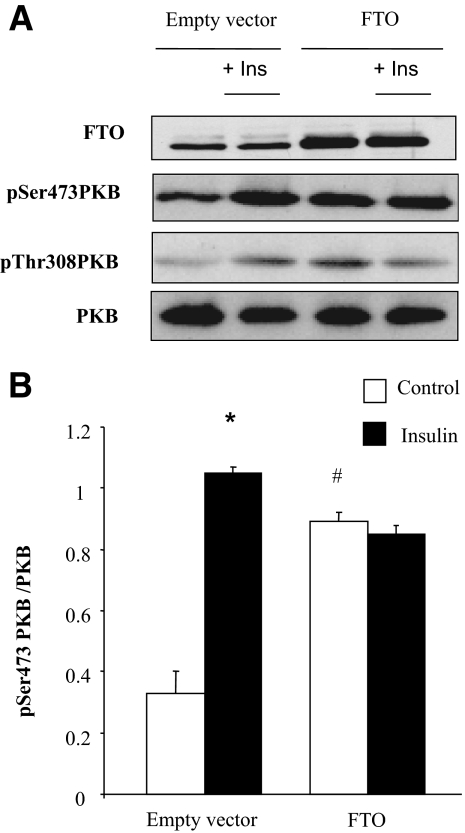
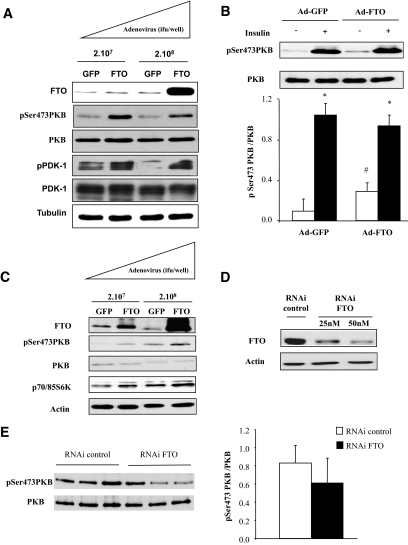
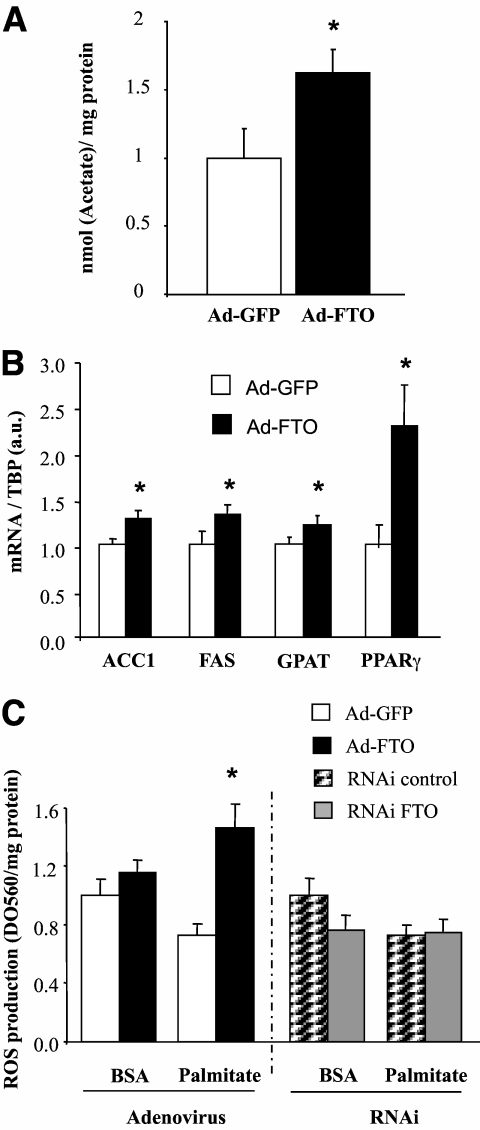
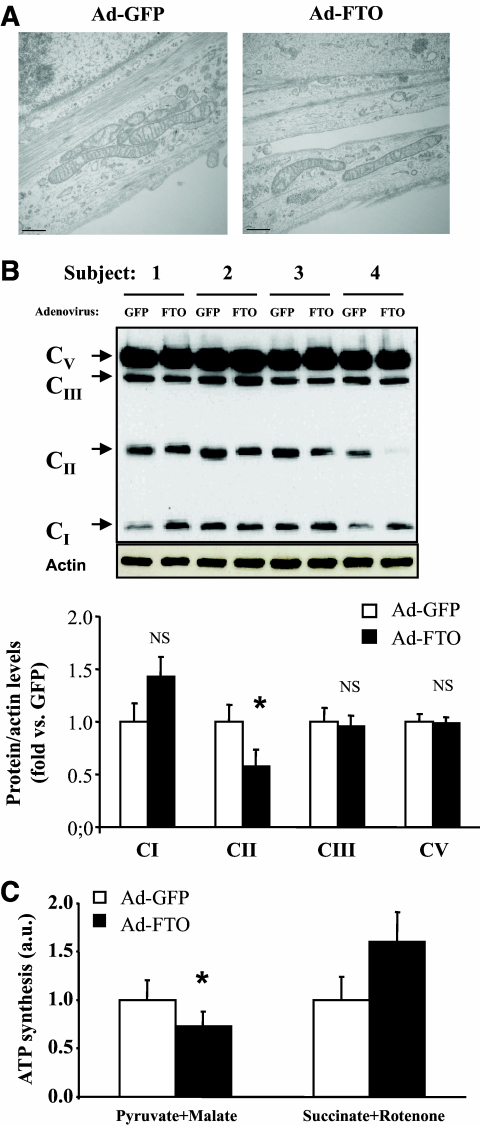
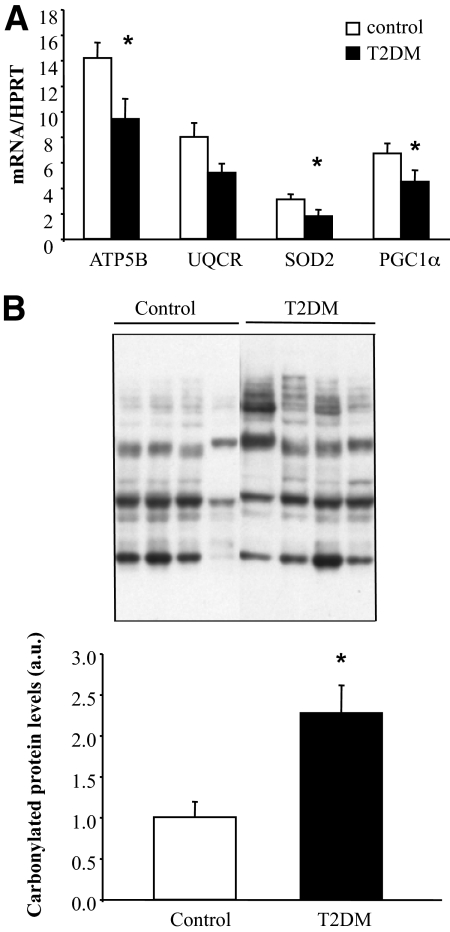
Results: We found a significant increase of FTO mRNA and protein levels in muscle from type 2 diabetic patients, whereas its expression was unchanged in obese or type 1 diabetic patients. Moreover, insulin or glucose infusion during specific clamps did not regulate FTO expression in skeletal muscle from control or type 2 diabetic patients. Interestingly, rosiglitazone treatment improved insulin sensitivity and reduced FTO expression in muscle from type 2 diabetic patients. In myotubes, adenoviral FTO overexpression increased basal protein kinase B phosphorylation, enhanced lipogenesis and oxidative stress, and reduced mitochondrial oxidative function, a cluster of metabolic defects associated with type 2 diabetes.
Conclusions: This study demonstrates increased FTO expression in skeletal muscle from type 2 diabetic patients, which can be normalized by thiazolidinedione treatment. Furthermore, in vitro data support a potential implication of FTO in oxidative metabolism, lipogenesis and oxidative stress in muscle, suggesting that it could be involved in the muscle defects that characterize type 2 diabetes.
Figures
Similar articles
-
Improved skeletal muscle oxidative enzyme activity and restoration of PGC-1 alpha and PPAR beta/delta gene expression upon rosiglitazone treatment in obese patients with type 2 diabetes mellitus.Int J Obes (Lond). 2007 Aug;31(8):1302-10. doi: 10.1038/sj.ijo.0803567. Epub 2007 Feb 20. Int J Obes (Lond). 2007. PMID: 17310221 Clinical Trial.
-
Reduced skeletal muscle uncoupling protein-3 content in prediabetic subjects and type 2 diabetic patients: restoration by rosiglitazone treatment.J Clin Endocrinol Metab. 2006 Apr;91(4):1520-5. doi: 10.1210/jc.2005-1572. Epub 2005 Dec 29. J Clin Endocrinol Metab. 2006. PMID: 16384852
-
Hydrogen peroxide production is not primarily increased in human myotubes established from type 2 diabetic subjects.J Clin Endocrinol Metab. 2011 Sep;96(9):E1486-90. doi: 10.1210/jc.2011-1384. Epub 2011 Jul 6. J Clin Endocrinol Metab. 2011. PMID: 21733990
-
Skeletal muscle mitochondrial protein metabolism and function in ageing and type 2 diabetes.Curr Opin Clin Nutr Metab Care. 2004 Jan;7(1):97-102. doi: 10.1097/00075197-200401000-00015. Curr Opin Clin Nutr Metab Care. 2004. PMID: 15090909 Review.
-
Mitochondrial function in skeletal muscle in type 2 diabetes.Dan Med Bull. 2011 Apr;58(4):B4272. Dan Med Bull. 2011. PMID: 21466770 Review.
Cited by
-
FTO Inhibits Insulin Secretion and Promotes NF-κB Activation through Positively Regulating ROS Production in Pancreatic β cells.PLoS One. 2015 May 27;10(5):e0127705. doi: 10.1371/journal.pone.0127705. eCollection 2015. PLoS One. 2015. PMID: 26018652 Free PMC article.
-
Skeletal muscle reactive oxygen species: a target of good cop/bad cop for exercise and disease.Redox Rep. 2014 May;19(3):97-106. doi: 10.1179/1351000213Y.0000000077. Epub 2014 Jan 3. Redox Rep. 2014. PMID: 24620937 Free PMC article. Review.
-
Changes in gene expression associated with FTO overexpression in mice.PLoS One. 2014 May 19;9(5):e97162. doi: 10.1371/journal.pone.0097162. eCollection 2014. PLoS One. 2014. PMID: 24842286 Free PMC article.
-
Studies on the fat mass and obesity-associated (FTO) gene and its impact on obesity-associated diseases.Genes Dis. 2022 May 6;10(6):2351-2365. doi: 10.1016/j.gendis.2022.04.014. eCollection 2023 Nov. Genes Dis. 2022. PMID: 37554175 Free PMC article. Review.
-
Associations of genetic variants in/near body mass index-associated genes with type 2 diabetes: a systematic meta-analysis.Clin Endocrinol (Oxf). 2014 Nov;81(5):702-10. doi: 10.1111/cen.12428. Epub 2014 Mar 13. Clin Endocrinol (Oxf). 2014. PMID: 24528214 Free PMC article.
References
-
- Frayling TM, Timpson NJ, Weedon MN, Zeggini E, Freathy RM, Lindgren CM, Perry JR, Elliott KS, Lango H, Rayner NW, Shields B, Harries LW, Barrett JC, Ellard S, Groves CJ, Knight B, Patch AM, Ness AR, Ebrahim S, Lawlor DA, Ring SM, Ben-Shlomo Y, Jarvelin MR, Sovio U, Bennett AJ, Melzer D, Ferrucci L, Loos RJ, Barroso I, Wareham NJ, Karpe F, Owen KR, Cardon LR, Walker M, Hitman GA, Palmer CN, Doney AS, Morris AD, Smith GD, Hattersley AT, McCarthy MI: A common variant in the FTO gene is associated with body mass index and predisposes to childhood and adult obesity. Science 2007;316:889–894 - PMC - PubMed
-
- Dina C, Meyre D, Gallina S, Durand E, Körner A, Jacobson P, Carlsson LM, Kiess W, Vatin V, Lecoeur C, Delplanque J, Vaillant E, Pattou F, Ruiz J, Weill J, Levy-Marchal C, Horber F, Potoczna N, Hercberg S, Le Stunff C, Bougnères P, Kovacs P, Marre M, Balkau B, Cauchi S, Chèvre JC, Froguel P: Variation in FTO contributes to childhood obesity and severe adult obesity. Nat Genet 2007;39:724–726 - PubMed
-
- Scuteri A, Sanna S, Chen WM, Uda M, Albai G, Strait J, Najjar S, Nagaraja R, Orrú M, Usala G, Dei M, Lai S, Maschio A, Busonero F, Mulas A, Ehret GB, Fink AA, Weder AB, Cooper RS, Galan P, Chakravarti A, Schlessinger D, Cao A, Lakatta E, Abecasis GR: Genome-wide association scan shows genetic variants in the FTO gene are associated with obesity-related traits. PLoS Genet 2007;3:e115. - PMC - PubMed
-
- Wåhlén K, Sjölin E, Hoffstedt J: The common rs9939609 gene variant of the fat mass- and obesity-associated gene FTO is related to fat cell lipolysis. J Lipid Res 2008;49:607–611 - PubMed
-
- Klöting N, Schleinitz D, Ruschke K, Berndt J, Fasshauer M, Tönjes A, Schön MR, Kovacs P, Stumvoll M, Blüher M: Inverse relationship between obesity and FTO gene expression in visceral adipose tissue in humans. Diabetologia 2008;51:641–647 - PubMed
Publication types
MeSH terms
Substances
LinkOut - more resources
Full Text Sources
Other Literature Sources
Medical
Molecular Biology Databases
