. 2010 Oct 13;30(41):13558-66.
doi: 10.1523/JNEUROSCI.0909-10.2010.

Spike timing and information transmission at retinogeniculate synapses

Affiliations

Spike timing and information transmission at retinogeniculate synapses

Daniel L Rathbun et al. J Neurosci. .

Abstract

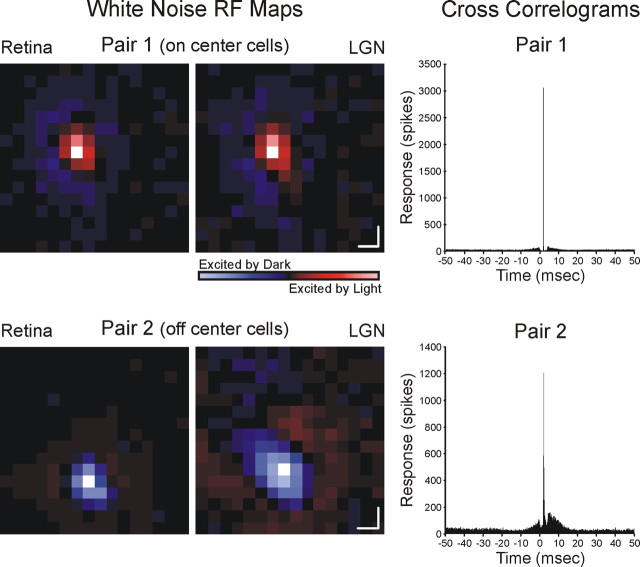
This study examines the rules governing the transfer of spikes between the retina and the lateral geniculate nucleus (LGN) with the goal of determining whether the most informative retinal spikes preferentially drive LGN responses and what role spike timing plays in the process. By recording from monosynaptically connected pairs of retinal ganglion cells and LGN neurons in vivo in the cat, we show that relayed spikes are more likely than nonrelayed spikes to be evoked by stimuli that match the receptive fields of the recorded cells and that an interspike interval-based mechanism contributes to the process. Relayed spikes are also more reliable in their timing and number where they often achieve the theoretical limit of minimum variance. As a result, relayed spikes carry more visual information per spike. Based on these results, we conclude that retinogeniculate processing increases sparseness in the neural code by selectively relaying the highest fidelity spikes to the visual cortex.


Figures

Figure 1.
Figure 1.
Receptive fields and cross-correlograms from two pairs of cells—a retinal ganglion cell and an LGN neuron—that met the criteria for a monosynaptic connection. Each pair of cells was recorded from simultaneously, in vivo, with separate electrodes in the eye and the LGN. Cells were excited with a spatiotemporal white-noise stimulus, and receptive fields were calculated using reverse-correlation analysis. In each receptive field map, red codes for on responses and blue for off responses; pixel brightness indicates the strength of response. The cells in pair 1 are on-center cells, and the cells in pair 2 are off-center cells; receptive fields are shown at the delay between stimulus and response that corresponds to maximum response. For each pair of cells, receptive fields overlap extensively. Scale bars indicate 1° of visual angle. The cross-correlograms to the right of the receptive field maps show the temporal relationship between spikes generated by the retinal ganglion cell and the simultaneously recorded LGN neuron under white-noise stimulation; bin size is 0.1 ms. Retinal spikes are set to time 0 and data points in the correlogram show the relative activity of the LGN neuron. The abrupt, short latency peak in each cross-correlogram indicates that the LGN neuron often fired a spike in response to a retinal spike.
Figure 2.
Figure 2.
Relayed retinal spikes have a stronger correlation with a visual stimulus than nonrelayed spikes. A, Three receptive field response maps made using three categories of spikes from a representative retinal ganglion cell: “all” spikes, “relayed” spikes, and “nonrelayed” spikes. Response maps were made using an equal number of spikes, and the maps are shown with the same color scale (pixel brightness) to compare response amplitude (correlation between stimulus and response) across the three categories of spikes. The histograms shown below the receptive field maps show the distribution of preceding ISIs for each category of spikes. The distribution of ISIs for relayed spikes is shifted to the left of that for nonrelayed spikes, indicating that relayed spikes are more likely to occur after short ISIs. B, Difference index histogram showing the relationship between the amplitudes of center subregions calculated from relayed and nonrelayed spikes across cell pairs (n = 17 pairs). The difference index is calculated as the difference between these amplitude values for relayed and nonrelayed spikes divided by their sum. Positive values indicate greater center amplitude for relayed spikes, and negative values indicate greater center amplitude for nonrelayed spikes.
Figure 3.
Figure 3.
Visual stimuli that best match the receptive fields of the retinal ganglion cell and LGN neuron are more likely to evoke relayed spikes and are more likely to drive short ISI responses. A, Scatterplot showing the relationship between the visual stimulus preceding relayed and nonrelayed retinal spikes and the STRF map of the retinal ganglion cell—quantified with the NDP—as a function of the strength of connection, “contribution,” between the retina and LGN. Contribution is equal to the percentage of LGN spikes that were evoked from the recorded retinal ganglion cell. Data points in vertical register (relayed and nonrelayed) are from the same pair of cells. Mean NDP values: Relayed spikes, 0.21 ± 0.2; nonrelayed spikes, 0.15 ± 0.2. B, Scatterplot showing the relationship between the visual stimulus preceding relayed and nonrelayed spikes and the STRF map of the LGN neuron—quantified with the NDP—as a function of the strength of connection, “contribution,” between the retina and LGN. Mean NDP values: relayed spikes = 0.19 ± 0.2, nonrelayed spikes = 0.08 ± 0.2. C, Scatterplot showing the relationship—quantified with the NDP—between the visual stimulus and the STRF map of a cell for relayed and nonrelayed retinal spikes. The open symbols indicate values when using the STRF of the retinal ganglion cell, and the filled symbols indicate values when using the STRF of the LGN cell. When using either the retinal or LGN STRF, NDP values are significantly greater for relayed spikes compared with nonrelayed spikes. D, Mean ISI distribution from our sample of retinal ganglion cells. This distribution was calculated by averaging the normalized histograms for each retinal cell. Error bars indicate SEM. E, Relationship between the efficacy of first and second retinal spikes in a pair as a function of ISI. Efficacy is the percentage of retinal spikes that drive LGN spikes. Second spikes have a greater efficacy than first spikes for ISIs up to ∼30 ms. The gray bands denote SEM. F, Histogram showing the mean relationship between normalized dot product values and retinal spikes that follow different ISIs, where the normalized dot product is a measure of how well the white-noise stimulus that preceded each spike matched the spatiotemporal receptive field map of each cell (see Materials and Methods). Retinal spikes that follow short ISIs are more likely to be evoked by stimuli that best match the receptive field of the retinal ganglion cell. Error bars indicate SEM.
Figure 4.
Figure 4.
Scatterplot showing an increased latency between stimulus and response for relayed retinal spikes compared with nonrelayed spikes. Latency is taken from the impulse response of each spike class and corresponds to the time between stimulus and maximum response. Across our sample of cell pairs, relayed spikes have a significantly longer latency than nonrelayed spikes. The crosshairs indicate mean and SEM.
Figure 5.
Figure 5.
Analysis of spike train statistics demonstrates that retinal firing events have high precision. A, Raster plot showing the occurrence of retinal spikes during 100 repetitions of a white-noise stimulus (300 ms of the 10 s stimulus shown). Relayed spikes are indicated with red ticks, and nonrelayed spikes are indicated with black ticks. B, D, F, Peristimulus time histograms for each spike class—all spikes, relayed spikes, and nonrelayed spikes—binned at 0.3 ms and smoothed. The solid lines indicate firing probability for each time bin. The vertical gray shading indicates the sum of all Gaussians fit to each event. Note that events distributed over a single bin could not be fitted by a Gaussian and are excluded from analysis. C, E, G, Scatterplots showing spike count variance versus spike count for the three categories of spikes: all spikes, relayed spikes, and nonrelayed spikes. Events were identified separately for each category of spikes. The diagonal lines indicate firing statistics expected by a purely Poisson spike generator; the lower scalloped lines denote the lowest possible variance at each mean spike count. Frequency/occurrence distributions are shown to the right of each scatterplot with a dashed line indicating the mean variance. The figure inset shows an expanded view of C illustrating the extent to which scallops are nested.
Figure 6.
Figure 6.
Spike timing and spike number are more precise for relayed spikes compared with nonrelayed spikes, leading to higher information content. A, Scatterplot comparing the temporal variance of relayed and nonrelayed spikes. Relayed spikes occur with significantly greater spike timing precision (less variance) than nonrelayed spikes. B, Scatterplot comparing the spike number variance of relayed and nonrelayed spikes. Relayed spikes have significantly less variance in spike number than nonrelayed spikes. C, Scatterplot comparing the amount of information (bits/spike) contained in relayed and nonrelayed spikes. Relayed spikes carry significantly greater information than nonrelayed spikes. The crosshairs indicate mean and SEM.

Similar articles

Cited by

References

    1. Alitto HJ, Weyand TG, Usrey WM. Distinct properties of stimulus-evoked bursts in the lateral geniculate nucleus. J Neurosci. 2005;25:514–523. - PMC - PubMed
    1. Alonso JM, Yeh CI, Weng C, Stoelzel C. Retinogeniculate connections: a balancing act between connection specificity and receptive field diversity. Prog Brain Res. 2006;154:3–13. - PMC - PubMed
    1. Barlow HB. Single units and sensation: a neuron doctrine for perceptual psychology. Perception. 1972;1:371–394. - PubMed
    1. Berry MJ, Warland DK, Meister M. The structure and precision of retinal spike trains. Proc Natl Acad Sci U S A. 1997;94:5411–5416. - PMC - PubMed
    1. Blitz DM, Regehr WG. Retinogeniculate synaptic properties controlling spike number and timing in relay neurons. J Neurophysiol. 2003;90:2438–2450. - PubMed

Publication types