. 2010 Oct 13;30(41):13630-43.
doi: 10.1523/JNEUROSCI.3226-10.2010.

Intrinsic plasticity complements long-term potentiation in parallel fiber input gain control in cerebellar Purkinje cells

Affiliations

Intrinsic plasticity complements long-term potentiation in parallel fiber input gain control in cerebellar Purkinje cells

Amor Belmeguenai et al. J Neurosci. .

Abstract

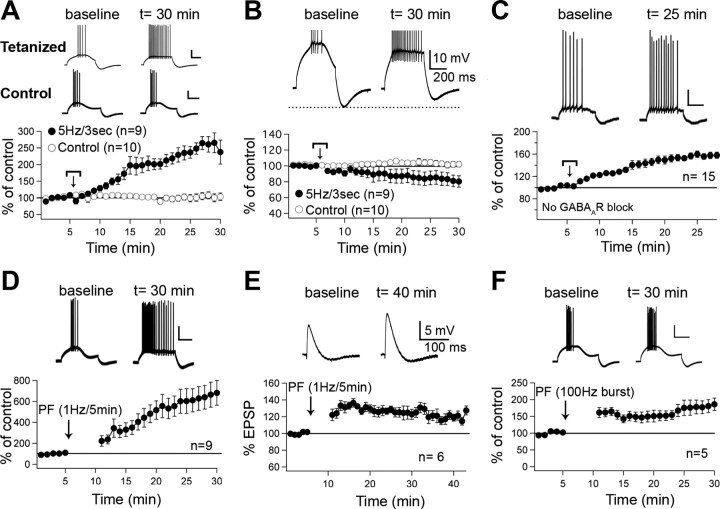
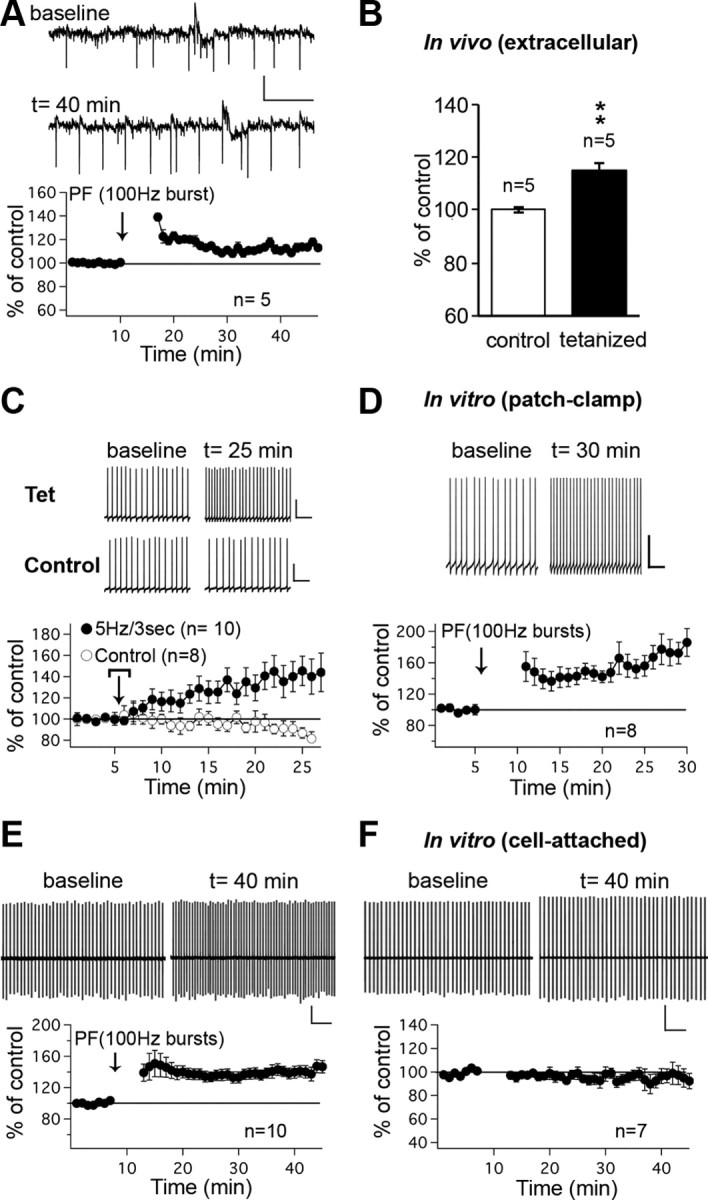
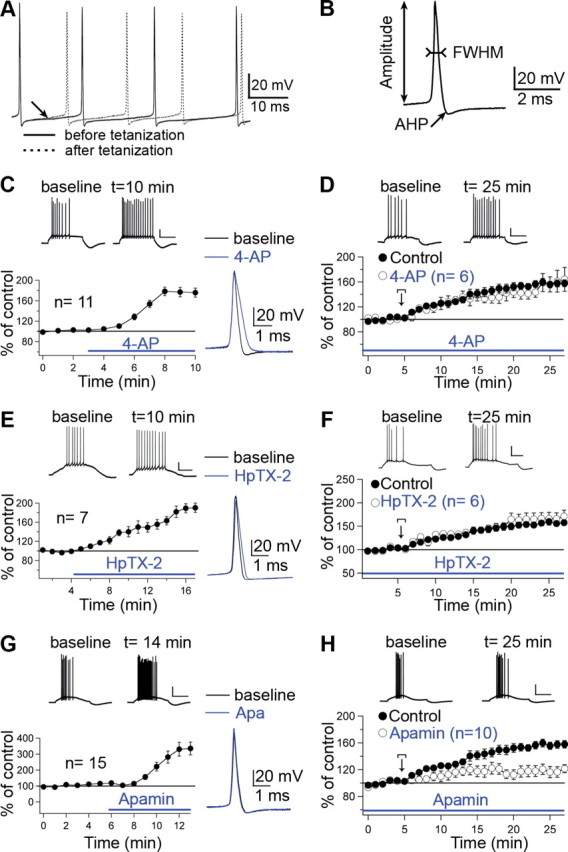
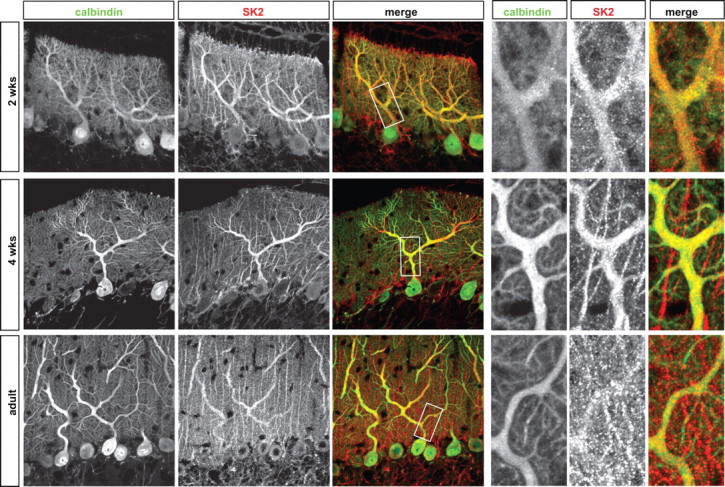
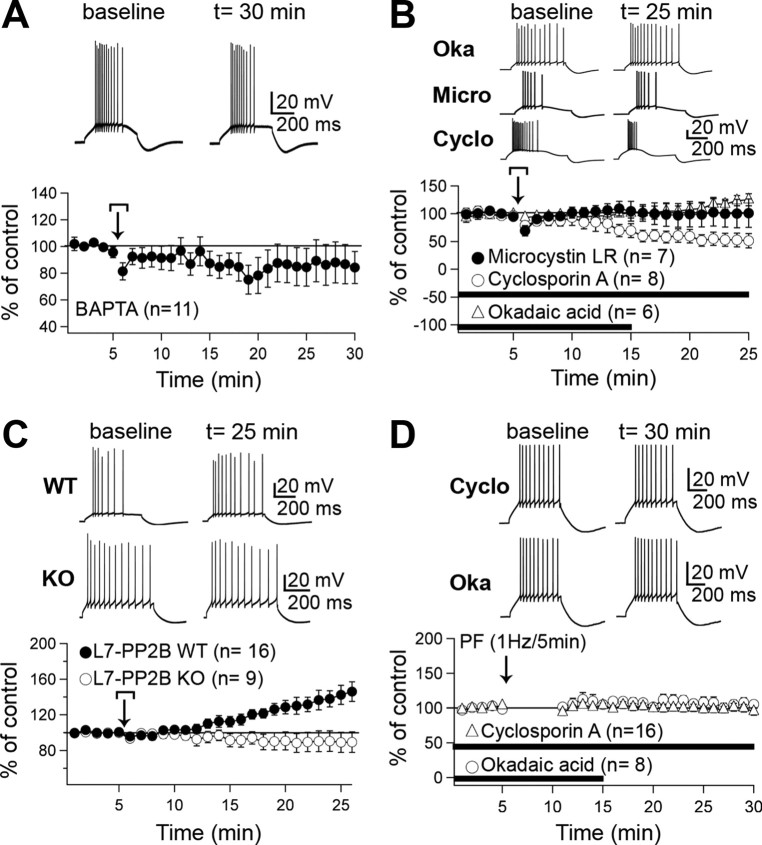
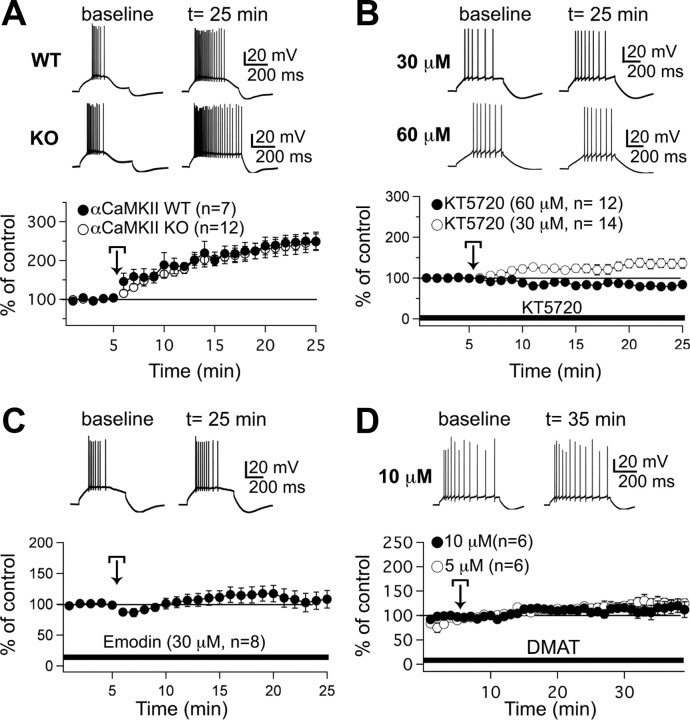
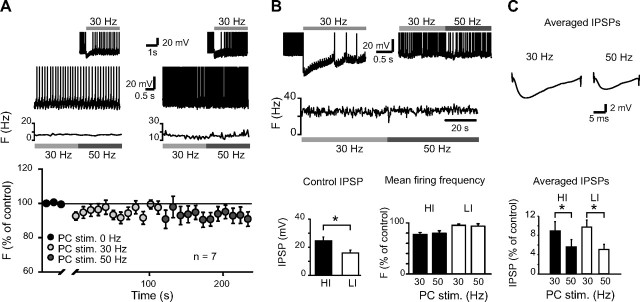
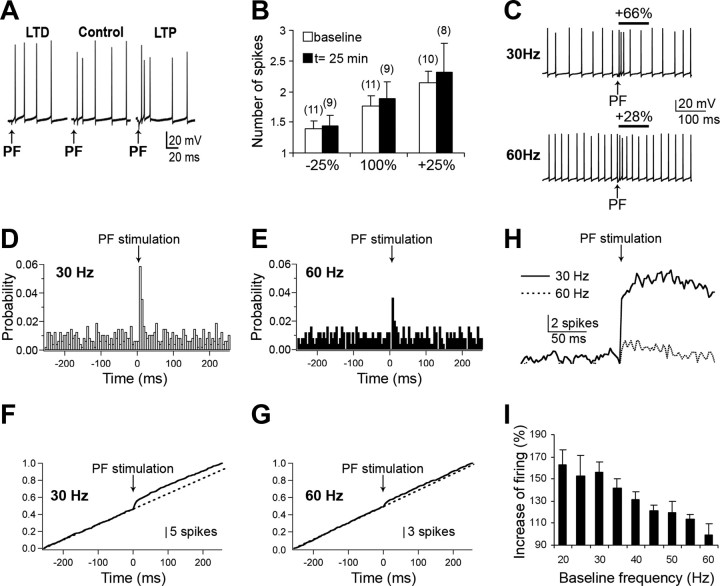
Synaptic gain control and information storage in neural networks are mediated by alterations in synaptic transmission, such as in long-term potentiation (LTP). Here, we show using both in vitro and in vivo recordings from the rat cerebellum that tetanization protocols for the induction of LTP at parallel fiber (PF)-to-Purkinje cell synapses can also evoke increases in intrinsic excitability. This form of intrinsic plasticity shares with LTP a requirement for the activation of protein phosphatases 1, 2A, and 2B for induction. Purkinje cell intrinsic plasticity resembles CA1 hippocampal pyramidal cell intrinsic plasticity in that it requires activity of protein kinase A (PKA) and casein kinase 2 (CK2) and is mediated by a downregulation of SK-type calcium-sensitive K conductances. In addition, Purkinje cell intrinsic plasticity similarly results in enhanced spine calcium signaling. However, there are fundamental differences: first, while in the hippocampus increases in excitability result in a higher probability for LTP induction, intrinsic plasticity in Purkinje cells lowers the probability for subsequent LTP induction. Second, intrinsic plasticity raises the spontaneous spike frequency of Purkinje cells. The latter effect does not impair tonic spike firing in the target neurons of inhibitory Purkinje cell projections in the deep cerebellar nuclei, but lowers the Purkinje cell signal-to-noise ratio, thus reducing the PF readout. These observations suggest that intrinsic plasticity accompanies LTP of active PF synapses, while it reduces at weaker, nonpotentiated synapses the probability for subsequent potentiation and lowers the impact on the Purkinje cell output.


Figures

Figure 1.
Figure 1.
Purkinje cell intrinsic plasticity can be elicited by application of repeated current steps or by PF tetanization. A, Repeated injection of depolarizing currents (5 Hz, 3 s/pulse duration: 100 ms; amplitude: 50–100 pA higher than in test pulses) enhanced the spike count (n = 9). Under control conditions, the spike count remained stable (n = 10). In these and the following in vitro experiments shown in this figure, spontaneous spike activity was prevented by the injection of hyperpolarizing bias currents. Calibration: 20 mV, 200 ms, unless stated otherwise. B, Following tetanization, the AHP amplitude was reduced (n = 9), but remained stable under control conditions (n = 10). The traces shown on top are identical to those shown in the top row in A, but are displayed using different scaling to allow for a better view of the AHP transients. C, Intrinsic plasticity was also observed in the absence of GABAA receptor blockers in the bath (n = 15). D, PF stimulation (1 Hz, 5 min) enhanced the spike count (n = 9). E, The same PF stimulation protocol elicited LTP of PF-EPSPs (n = 6). F, 100 Hz PF burst stimulation triggered an increase in intrinsic excitability (n = 5). Arrows indicate the time point of tetanization. Application of the nonsynaptic depolarization protocol is indicated by the current step symbol. In all recordings except for the experiments shown in C, GABAA receptors were blocked. Error bars indicate SEM.
Figure 2.
Figure 2.
Changes in the spontaneous Purkinje cell spike rate recorded in vivo and in vitro. A, 100 Hz PF burst stimulation caused an increase in simple spike firing in vivo (n = 5). The time graph shows the percentage change of the recorded spike frequency (Hz). The traces show single-unit extracellular recordings before (top) and after tetanization (bottom). Calibration: 0.2 mV, 50 ms. B, Bar graph comparing the spike rate observed after PF burst stimulation (n = 5; 0–30 min after tetanus) to that measured under control conditions (n = 5). C, Repeated current injection enhanced the spontaneous Purkinje cell spike rate in vitro (closed circles; n = 10). Under control conditions, the spike rate was not enhanced (open circles; n = 8). D, 100 Hz PF tetanization also caused an increase in the tonic spike rate in vitro (n = 8). C, D, Calibration: 20 mV, 200 ms. E, In cell-attached recordings in vitro, 100 Hz PF stimulation enhanced spontaneous spike firing (n = 10). F, This increase was not seen under control conditions (n = 7). Calibration: E, 100 pA, 200 ms; F, 200 pA, 200 ms. For these recordings, only cells were used that showed regular simple spike firing. The arrows indicate the time point of tetanization. All experiments shown in this figure were performed in the absence of GABAA receptor blockers in the bath. Error bars indicate SEM.
Figure 3.
Figure 3.
Cellular mechanisms underlying Purkinje cell intrinsic plasticity. A, Under control conditions, intrinsic plasticity was not associated with changes in the waveform of individual action potentials (n = 5). However, the spike rate was enhanced, because action potentials were followed by a faster depolarization toward spike threshold (arrow). B, Parameters of the action potential waveform that were monitored, including the peak amplitude, the AHP amplitude, the 10–90% rise time, the full width at half magnitude (FWHM), and the rate of postspike depolarization (measured as the membrane potential, Em, 4.5–6 ms after the spike peak). C, Bath application of 4-AP (100 μm) enhanced the spike count (n = 11), and prolonged the action potential width (right). D, 4-AP application did not block excitability increases triggered by tetanic current injection (n = 6). E, Bath application of heteropodatoxin-2 (100 nm) also enhanced the spike count (n = 7) and slightly prolonged the spike width (right). F, Heteropodatoxin-2 did not occlude excitability changes triggered by the current injection protocol (n = 6). G, Bath application of the SK-channel antagonist apamin (3 nm) increased the excitability (n = 15) without affecting the action potential waveform (right). H, Apamin application partially occluded excitability increases following tetanic current injection (n = 10). In the occlusion experiments (D, F, H), after drug application the spike count was readjusted to baseline levels by changing the current step/holding current amplitude (see supplemental Fig. 4, available at www.jneurosci.org as supplemental material). In these experiments, inhibitory transmission was left intact. Error bars indicate SEM.
Figure 4.
Figure 4.
SK2 channel immunostaining. Anti-SK2-channel (red) and anti-calbindin (green) antibody stainings of cerebellar sections obtained from 2 week-old (top row), 4 week-old (middle row), and adult (bottom row) rats show SK2-staining in Purkinje cell dendrites and throughout the molecular layer. Right side, Enlarged views taken from the areas indicated by white boxes on the left.
Figure 5.
Figure 5.
Purkinje cell intrinsic plasticity depends on calcium signaling, and activation of protein phosphatases 1, 2A, and 2B. A, Intrinsic plasticity was blocked when BAPTA (20 mm) was added to the pipette saline (n = 11). B, Likewise, the current injection protocol was ineffective in the presence of the PP1/2A inhibitor microcystin LR (10 μm; closed circles; n = 7), the PP1/2A inhibitor okadaic acid (1 μm; open triangles; n = 6), and the PP2B inhibitor cyclosporin A (100 μm; open circles; n = 8). C, Intrinsic plasticity was intact in slices prepared from wild-type mice (closed circles; n = 16), but was inhibited in slices prepared from L7-PP2B knock-out mice (open circles; n = 9). D, Application of the 1 Hz PF stimulation protocol failed to induce excitability changes in the presence of okadaic acid (1 μm; open circles; n = 8) and cyclosporin A (100 μm; open triangles; n = 16). Error bars indicate SEM.
Figure 6.
Figure 6.
Involvement of protein kinases in Purkinje cell intrinsic plasticity. A, Intrinsic plasticity was observed in αCaMKII knock-out mice (open circles; n = 12) and wild-type controls (closed circles; n = 7). B, Bath application of the PKA inhibitor KT5720 at 30 μm (open circles; n = 14) and 60 μm (closed circles; n = 12) affected intrinsic plasticity. C, Excitability increases were prevented by bath application of the CK2 inhibitor emodin (30 μm; n = 8). D, Intrinsic plasticity was also blocked by bath application of the CK2 inhibitor DMAT at 5 μm (open circles; n = 6) and 10 μm (closed circles; n = 6). Error bars indicate SEM.
Figure 7.
Figure 7.
Intrinsic plasticity-associated changes in the spontaneous Purkinje cell spike rate do not affect the tonic spike rate of DCN neurons. A, Bottom, the spike frequency of DCN neurons (F) remained stable when the increase in Purkinje cell spike rates was mimicked by a switch from 30 to 50 Hz stimulation of Purkinje cell axons (n = 7; values for the onset of 30 Hz activation are not depicted). Top, Two example recordings. The insets show the effect of a switch from 0 to 30 Hz stimulation of the inhibitory synapses. B, Top, Example recordings using a higher stimulus intensity. Bottom, Increasing the stimulus intensity resulted in larger amplitudes of control IPSPs (0.1 Hz, left), but the effect of tonic stimulation at 30 and 50 Hz on the firing rate of DCN neurons was similar using high (HI; n = 8) or low intensities (LI; n = 7). C, Bottom, At both high and low stimulus intensities, IPSP amplitudes were reduced to a larger degree at 50 Hz than at 30 Hz stimulation (averaged over 1 min before and after the frequency switch). Top, Example traces illustrating averaged IPSPs. The traces were taken from the same recording shown in B. Error bars indicate SEM. *p < 0.05.
Figure 8.
Figure 8.
Purkinje cell intrinsic plasticity lowers the impact of PF signaling. A, Intrinsic plasticity does not affect the synaptic input–output curve of Purkinje cells. PF stimulus strength was varied by ±25%, which approximately corresponds to amplitude changes seen after LTP and LTD induction. B, The linear relationship between stimulus strength and the number of evoked spikes was not significantly affected by intrinsic plasticity (n = 8–9; paired Student's t test; p > 0.05; the number of spikes evoked at all three stimulus strengths was compared before and after inducing intrinsic plasticity). The spike count includes all spikes that occurred at elevated frequency after PF stimulus onset during a 100 ms time window. The number of recordings is indicated in the brackets. C, When the background spike rate was enhanced from 30 Hz (top) to 60 Hz (bottom), the net increase in spike numbers evoked by constant PF stimulation was lowered. D, E, PSTHs calculated from PF responses at background spike frequencies of 30 Hz (D) and 60 Hz (E). F, G, Cumulative spike probabilities at 30 Hz (F) and 60 Hz (G). The dotted line represents a fit to the baseline. H, Corrected cumulative spike probabilities after subtraction of the baseline fit at 30 Hz and 60 Hz. I, Inverse relationship between the spike rate and the net increase in spike firing, which was calculated from 100 ms time windows before and after PF stimulation (n = 7). The analysis shown in DH is based on 477 spikes (30 Hz) and 247 spikes (60 Hz), respectively (n = 7). Error bars indicate SEM.
Figure 9.
Figure 9.
Intrinsic plasticity enhances spine calcium signaling, but blocks subsequent LTP induction. A, PF-EPSPs (right) and the spike count (left) were monitored after tetanic current injection (n = 8) and after subsequent application of the 1 Hz PF tetanization protocol (n = 5). LTP induction was blocked after previous application of the intrinsic plasticity protocol (black circles; n = 5). In contrast, LTP was induced by PF stimulation, when intrinsic plasticity was not previously triggered (white circles; n = 6). Top, Traces show EPSPs and depolarization-evoked spikes under baseline conditions (left), after application of the intrinsic plasticity protocol (middle), and after application of the PF-LTP protocol (right). In all recordings shown in A, inhibition was left intact. Calibration: 20 mV, 200 ms. B–H, Confocal calcium imaging experiments reveal an increase in spine calcium transients. B, Top, Purkinje cell filled with the fluorescent calcium indicator Oregon Green BAPTA-2 (200 μm). Scale bar, 20 μm. Bottom, Enhanced view of the area marked by the red box in the top image. The red circle indicates the region of interest. Scale bar, 2 μm. C, The spike count was monitored before (left) and after tetanization (right). D, Calcium transients were evoked by 100 Hz PF stimulation (4 pulses). PF responses are shown before (left) and after tetanization (right). E, Calcium transients evoked by the PF responses shown in D. The traces represent averages of 3 calcium transients. F, An overlay of the calcium transients reveals enhanced calcium signaling. G, Bar graph showing averaged changes in the area under the curve (left) and peak of calcium transients (middle), as well as the spike count (right). These values represent averages taken during a 12 min period following tetanization (n = 7). H, Comparison of calcium transient changes (area under the curve) in spines and associated shaft regions (n = 7). Error bars indicate SEM.

Similar articles

Cited by

References

    1. Aizenman CD, Linden DJ. Rapid, synaptically driven increases in the intrinsic excitability of cerebellar deep nuclear neurons. Nat Neurosci. 2000;3:109–111. - PubMed
    1. Allen D, Fakler B, Maylie J, Adelman JP. Organization and regulation of small conductance Ca2+-activated K+ channel multiprotein complexes. J Neurosci. 2007;27:2369–2376. - PMC - PubMed
    1. Alviña K, Walter JT, Kohn A, Ellis-Davies G, Khodakhah K. Questioning the role of rebound firing in the cerebellum. Nat Neurosci. 2008;11:1256–1258. - PMC - PubMed
    1. Angelo K, London M, Christensen SR, Häusser M. Local and global effects of Ih distribution in dendrites of mammalian neurons. J Neurosci. 2007;27:8643–8653. - PMC - PubMed
    1. Armano S, Rossi P, Taglietti V, D'Angelo E. Long-term potentiation of intrinsic excitability at the mossy fiber-granule cell synapse of rat cerebellum. J Neurosci. 2000;20:5208–5216. - PMC - PubMed

Publication types

LinkOut - more resources