Brain dynamics underlying training-induced improvement in suppressing inappropriate action
- PMID: 20943907
- PMCID: PMC6633710
- DOI: 10.1523/JNEUROSCI.2064-10.2010
Brain dynamics underlying training-induced improvement in suppressing inappropriate action
Abstract
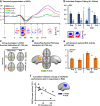
Inhibitory control, a core component of executive functions, refers to our ability to suppress intended or ongoing cognitive or motor processes. Mostly based on Go/NoGo paradigms, a considerable amount of literature reports that inhibitory control of responses to "NoGo" stimuli is mediated by top-down mechanisms manifesting ∼200 ms after stimulus onset within frontoparietal networks. However, whether inhibitory functions in humans can be trained and the supporting neurophysiological mechanisms remain unresolved. We addressed these issues by contrasting auditory evoked potentials (AEPs) to left-lateralized "Go" and right NoGo stimuli recorded at the beginning versus the end of 30 min of active auditory spatial Go/NoGo training, as well as during passive listening of the same stimuli before versus after the training session, generating two separate 2 × 2 within-subject designs. Training improved Go/NoGo proficiency. Response times to Go stimuli decreased. During active training, AEPs to NoGo, but not Go, stimuli modulated topographically with training 61-104 ms after stimulus onset, indicative of changes in the underlying brain network. Source estimations revealed that this modulation followed from decreased activity within left parietal cortices, which in turn predicted the extent of behavioral improvement. During passive listening, in contrast, effects were limited to topographic modulations of AEPs in response to Go stimuli over the 31-81 ms interval, mediated by decreased right anterior temporoparietal activity. We discuss our results in terms of the development of an automatic and bottom-up form of inhibitory control with training and a differential effect of Go/NoGo training during active executive control versus passive listening conditions.
Figures


Similar articles
-
Enhancing frontal top-down inhibitory control with Go/NoGo training.Brain Struct Funct. 2016 Sep;221(7):3835-42. doi: 10.1007/s00429-015-1131-7. Epub 2015 Oct 12. Brain Struct Funct. 2016. PMID: 26459141
-
Stimulus Reward Value Interacts with Training-induced Plasticity in Inhibitory Control.Neuroscience. 2019 Nov 21;421:82-94. doi: 10.1016/j.neuroscience.2019.10.010. Epub 2019 Nov 6. Neuroscience. 2019. PMID: 31705887
-
Interhemispheric coupling between the posterior sylvian regions impacts successful auditory temporal order judgment.Neuropsychologia. 2010 Jul;48(9):2579-85. doi: 10.1016/j.neuropsychologia.2010.05.004. Epub 2010 May 8. Neuropsychologia. 2010. PMID: 20457165
-
Plastic modifications within inhibitory control networks induced by practicing a stop-signal task: an electrical neuroimaging study.Cortex. 2013 Apr;49(4):1141-7. doi: 10.1016/j.cortex.2012.12.009. Epub 2012 Dec 19. Cortex. 2013. PMID: 23313010
-
Differential patterns of functional and structural plasticity within and between inferior frontal gyri support training-induced improvements in inhibitory control proficiency.Hum Brain Mapp. 2015 Jul;36(7):2527-43. doi: 10.1002/hbm.22789. Epub 2015 Mar 19. Hum Brain Mapp. 2015. PMID: 25801718 Free PMC article.
Cited by
-
Aging Modulates Prefrontal Plasticity Induced by Executive Control Training.Cereb Cortex. 2021 Jan 5;31(2):809-825. doi: 10.1093/cercor/bhaa259. Cereb Cortex. 2021. PMID: 32930336 Free PMC article. Clinical Trial.
-
Different inhibitory control components predict different levels of language control in bilinguals.Mem Cognit. 2021 May;49(4):758-770. doi: 10.3758/s13421-020-01131-4. Epub 2021 Jan 4. Mem Cognit. 2021. PMID: 33398787
-
Online transcranial magnetic stimulation reveals dynamic interactions between language control and processing in bilingual language production.Cereb Cortex. 2024 Nov 5;34(11):bhae452. doi: 10.1093/cercor/bhae452. Cereb Cortex. 2024. PMID: 39604075 Free PMC article.
-
Brain training in progress: a review of trainability in healthy seniors.Front Hum Neurosci. 2012 Jun 21;6:183. doi: 10.3389/fnhum.2012.00183. eCollection 2012. Front Hum Neurosci. 2012. PMID: 22737115 Free PMC article.
-
Training-induced behavioral and brain plasticity in inhibitory control.Front Hum Neurosci. 2013 Aug 1;7:427. doi: 10.3389/fnhum.2013.00427. eCollection 2013. Front Hum Neurosci. 2013. PMID: 23914169 Free PMC article.
References
-
- Andersen RA, Snyder LH, Bradley DC, Xing J. Multimodal representation of space in the posterior parietal cortex and its use in planning movements. Annu Rev Neurosci. 1997;20:303–330. - PubMed
-
- Aron AR, Robbins TW, Poldrack RA. Inhibition and the right inferior frontal cortex. Trends Cogn Sci. 2004;8:170–177. - PubMed
-
- Blauert J. Spatial hearing (revised edition) Cambridge, MA: Massachusetts Institute of Technology; 1997.
-
- Botvinick MM, Braver TS, Barch DM, Carter CS, Cohen JD. Conflict monitoring and cognitive control. Psychol Rev. 2001;108:624–652. - PubMed
Publication types
MeSH terms
LinkOut - more resources
Full Text Sources
Other Literature Sources
