Spontaneous seizures and altered gene expression in GABA signaling pathways in a mind bomb mutant zebrafish
- PMID: 20943912
- PMCID: PMC2962868
- DOI: 10.1523/JNEUROSCI.1887-10.2010
Spontaneous seizures and altered gene expression in GABA signaling pathways in a mind bomb mutant zebrafish
Abstract
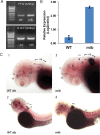
Disruption of E3 ubiquitin ligase activity in immature zebrafish mind bomb mutants leads to a failure in Notch signaling, excessive numbers of neurons, and depletion of neural progenitor cells. This neurogenic phenotype is associated with defects in neural patterning and brain development. Because developmental brain abnormalities are recognized as an important feature of childhood neurological disorders such as epilepsy and autism, we determined whether zebrafish mutants with grossly abnormal brain structure exhibit spontaneous electrical activity that resembles the long-duration, high-amplitude multispike discharges reported in immature zebrafish exposed to convulsant drugs. Electrophysiological recordings from agar immobilized mind bomb mutants at 3 d postfertilization confirmed the occurrence of electrographic seizure activity; seizure-like behaviors were also noted during locomotion video tracking of freely behaving mutants. To identify genes differentially expressed in the mind bomb mutant and provide insight into molecular pathways that may mediate these epileptic phenotypes, a transcriptome analysis was performed using microarray. Interesting candidate genes were further analyzed using conventional reverse transcriptase-PCR and real-time quantitative PCR, as well as whole-mount in situ hybridization. Approximately 150 genes, some implicated in development, transcription, cell metabolism, and signal transduction, are differentially regulated, including downregulation of several genes necessary for GABA-mediated signaling. These findings identify a collection of gene transcripts that may be responsible for the abnormal electrical discharge and epileptic activities observed in a mind bomb zebrafish mutant. This work may have important implications for neurological and neurodevelopmental disorders associated with mutations in ubiquitin ligase activity.
Figures


Similar articles
-
Aberrant expression of genes necessary for neuronal development and Notch signaling in an epileptic mind bomb zebrafish.Dev Dyn. 2011 Aug;240(8):1964-76. doi: 10.1002/dvdy.22680. Epub 2011 Jun 17. Dev Dyn. 2011. PMID: 21688347 Free PMC article.
-
Transcriptome analysis of the zebrafish mind bomb mutant.Mol Genet Genomics. 2009 Jan;281(1):77-85. doi: 10.1007/s00438-008-0395-5. Epub 2008 Nov 13. Mol Genet Genomics. 2009. PMID: 19005681
-
Genomewide expression analysis in zebrafish mind bomb alleles with pancreas defects of different severity identifies putative Notch responsive genes.PLoS One. 2008 Jan 23;3(1):e1479. doi: 10.1371/journal.pone.0001479. PLoS One. 2008. PMID: 18213387 Free PMC article.
-
Notch and Cdk5 in Zebrafish Mindbomb Mutant: Co-regulation or Coincidence?Folia Biol (Praha). 2018;64(2):35-40. doi: 10.14712/fb2018064020035. Folia Biol (Praha). 2018. PMID: 30338754 Free PMC article. Review.
-
Notch signaling: endocytosis makes delta signal better.Curr Biol. 2003 Apr 1;13(7):R273-5. doi: 10.1016/s0960-9822(03)00199-4. Curr Biol. 2003. PMID: 12676105 Review.
Cited by
-
A comparative study to optimize experimental conditions of pentylenetetrazol and pilocarpine-induced epilepsy in zebrafish larvae.PLoS One. 2023 Jul 28;18(7):e0288904. doi: 10.1371/journal.pone.0288904. eCollection 2023. PLoS One. 2023. PMID: 37506089 Free PMC article.
-
A zebrafish-centric approach to antiepileptic drug development.Dis Model Mech. 2021 Jul 1;14(7):dmm049080. doi: 10.1242/dmm.049080. Epub 2021 Jul 7. Dis Model Mech. 2021. PMID: 34231838 Free PMC article.
-
Neurogenic Effects of Inorganic Arsenic and Cdk5 Knockdown in Zebrafish Embryos: A Perspective on Modeling Autism.Int J Mol Sci. 2024 Mar 19;25(6):3459. doi: 10.3390/ijms25063459. Int J Mol Sci. 2024. PMID: 38542432 Free PMC article. Review.
-
Behavioral Changes Over Time Following Ayahuasca Exposure in Zebrafish.Front Behav Neurosci. 2017 Jul 28;11:139. doi: 10.3389/fnbeh.2017.00139. eCollection 2017. Front Behav Neurosci. 2017. PMID: 28804451 Free PMC article.
-
Post-Developmental Roles of Notch Signaling in the Nervous System.Biomolecules. 2020 Jul 1;10(7):985. doi: 10.3390/biom10070985. Biomolecules. 2020. PMID: 32630239 Free PMC article. Review.
References
-
- Akbarian S, Huang HS. Molecular and cellular mechanisms of altered GAD1/GAD67 expression in schizophrenia and related disorders. Brain Res Rev. 2006;52:293–304. - PubMed
-
- Andersen CL, Jensen JL, Ørntoft TF. Normalization of real-time quantitative reverse transcription-PCR data: a model-based variance estimation approach to identify genes suited for normalization, applied to bladder and colon cancer data sets. Cancer Res. 2004;64:5245–5250. - PubMed
-
- Baraban SC, Taylor MR, Castro PA, Baier H. Pentylenetetrazole induced changes in zebrafish behavior, neural activity and c-fos expression. Neuroscience. 2005;131:759–768. - PubMed
Publication types
MeSH terms
Substances
Grants and funding
LinkOut - more resources
Full Text Sources
Other Literature Sources
Medical
Molecular Biology Databases
