Comparative Study
. 2010 Oct 13;30(41):13739-49.
doi: 10.1523/JNEUROSCI.0743-10.2010.

Comparisons of the dynamics of local field potential and multiunit activity signals in macaque visual cortex

Affiliations
Comparative Study

Comparisons of the dynamics of local field potential and multiunit activity signals in macaque visual cortex

Samuel P Burns et al. J Neurosci. .

Abstract

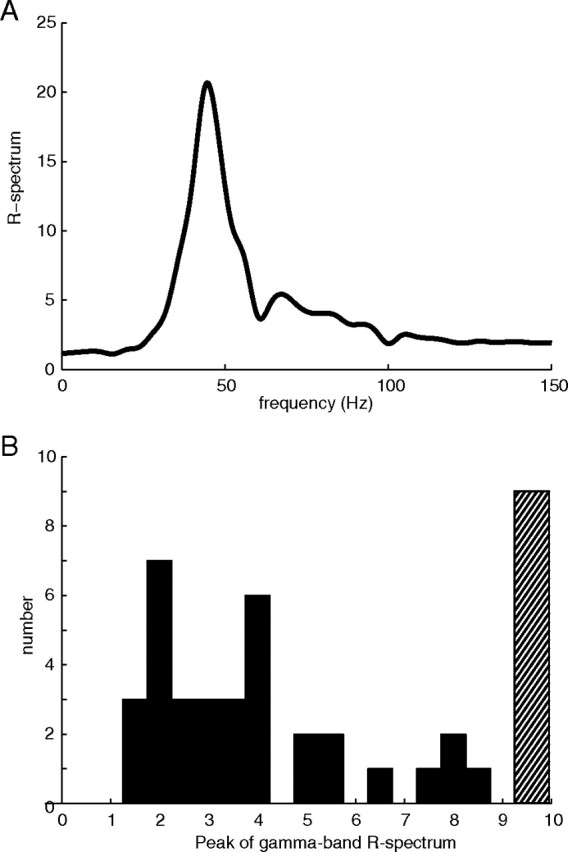
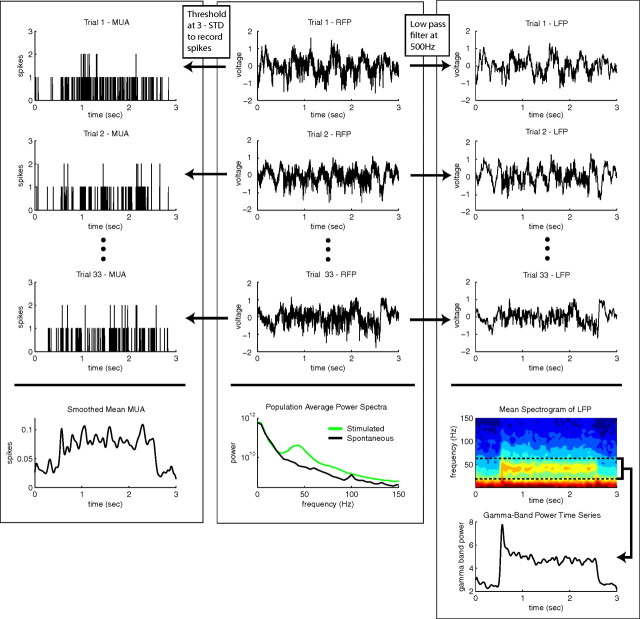
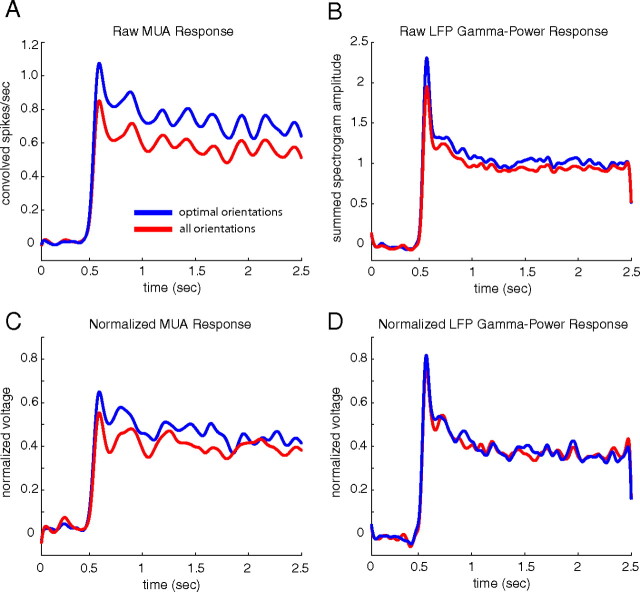
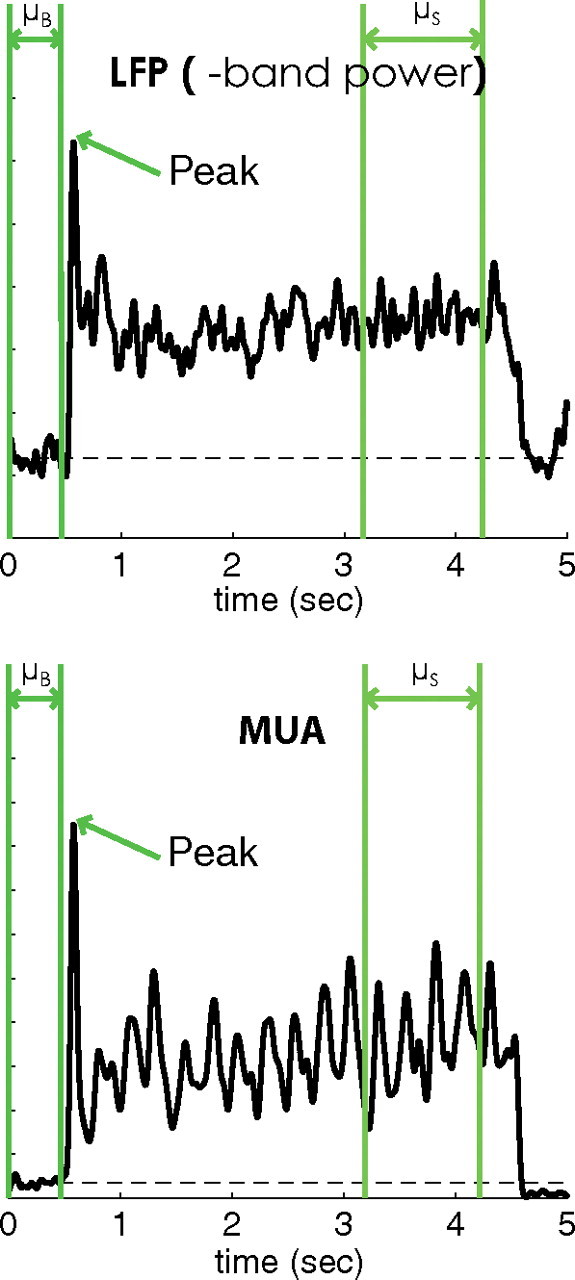
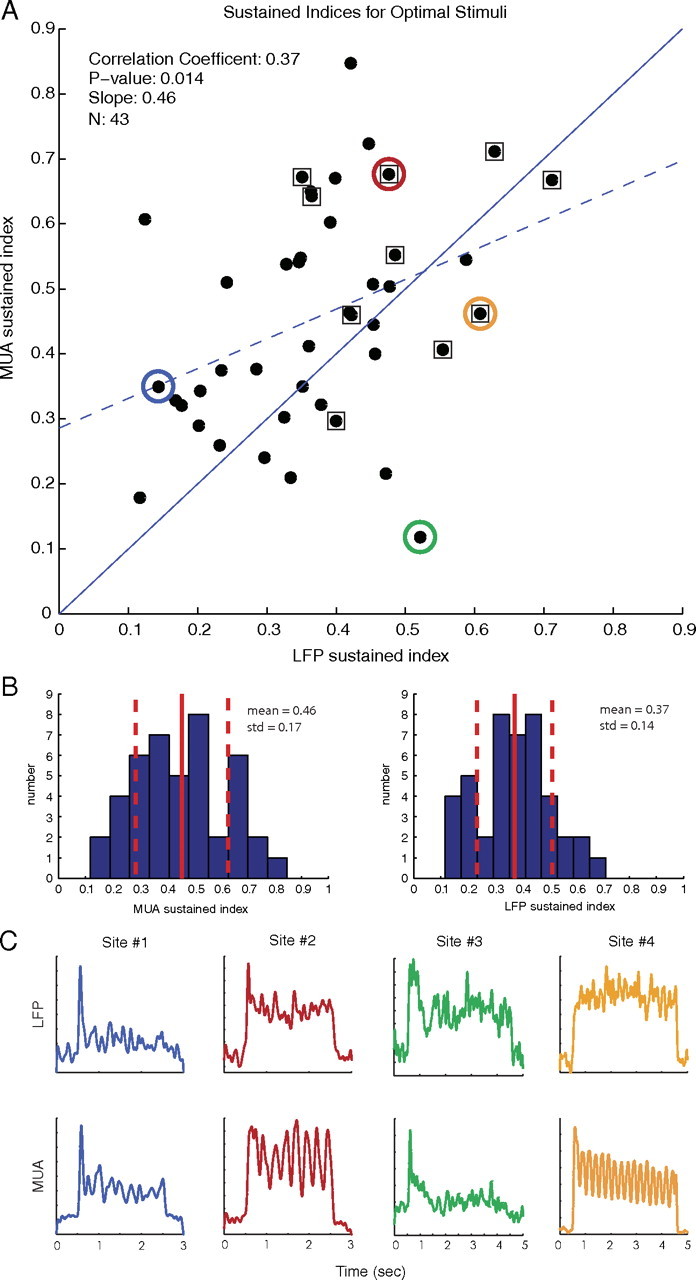
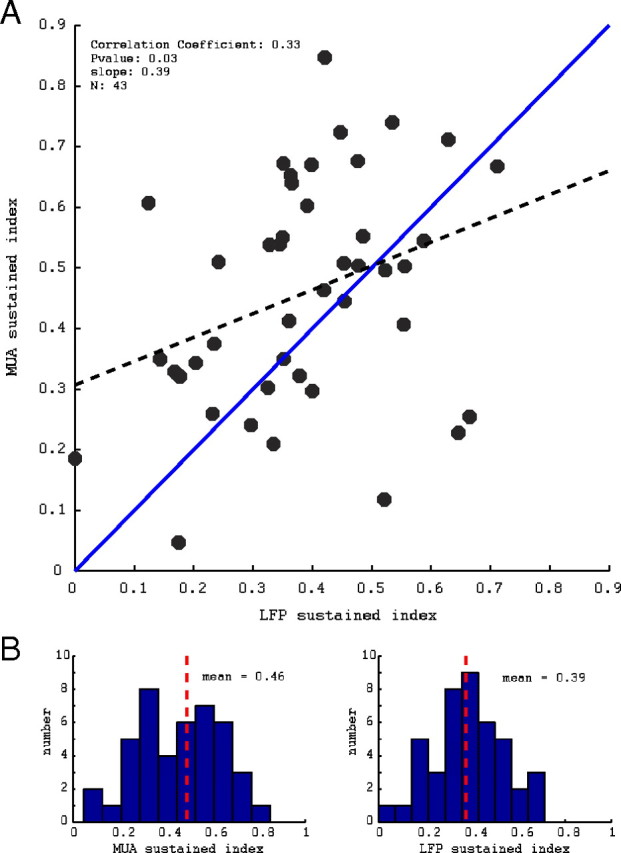
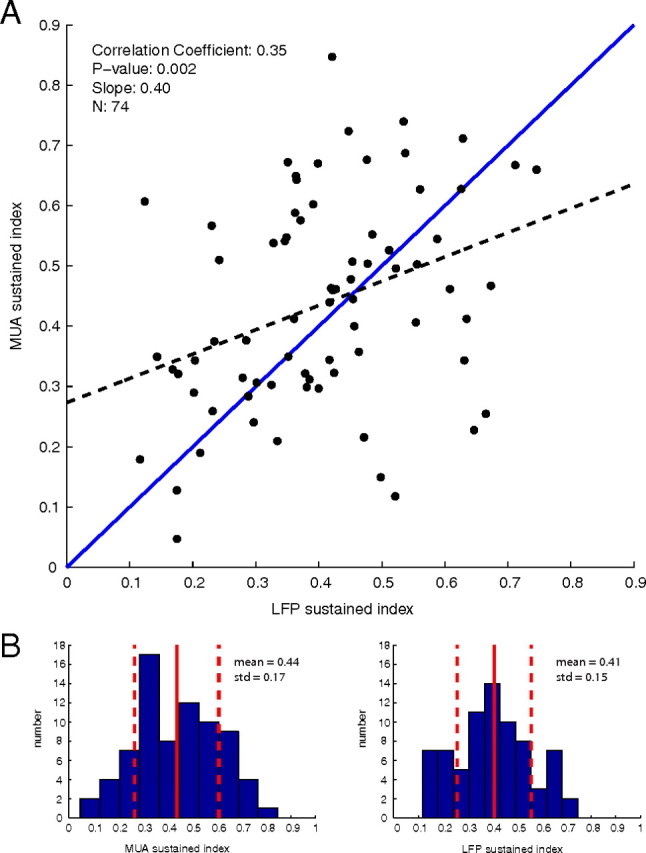
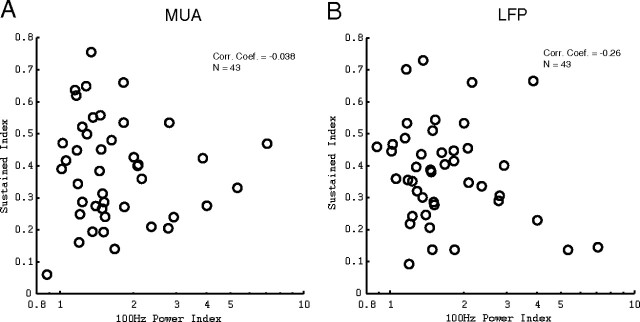
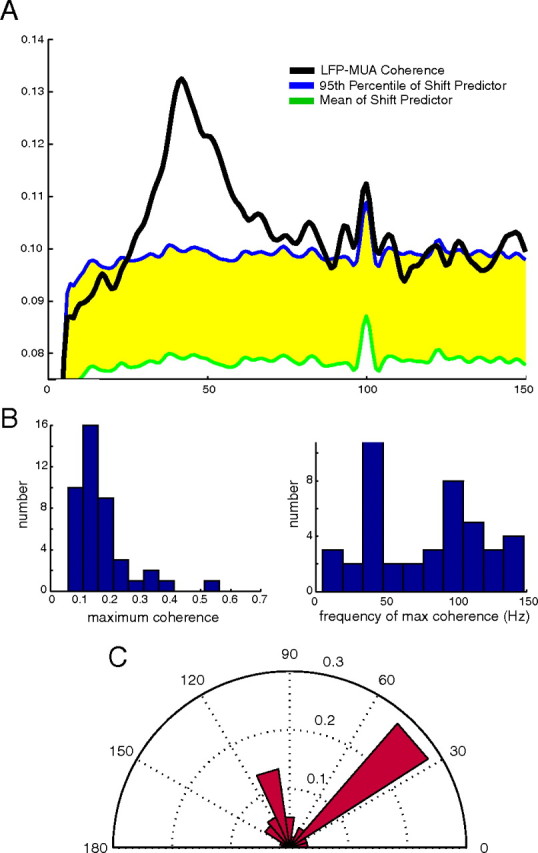
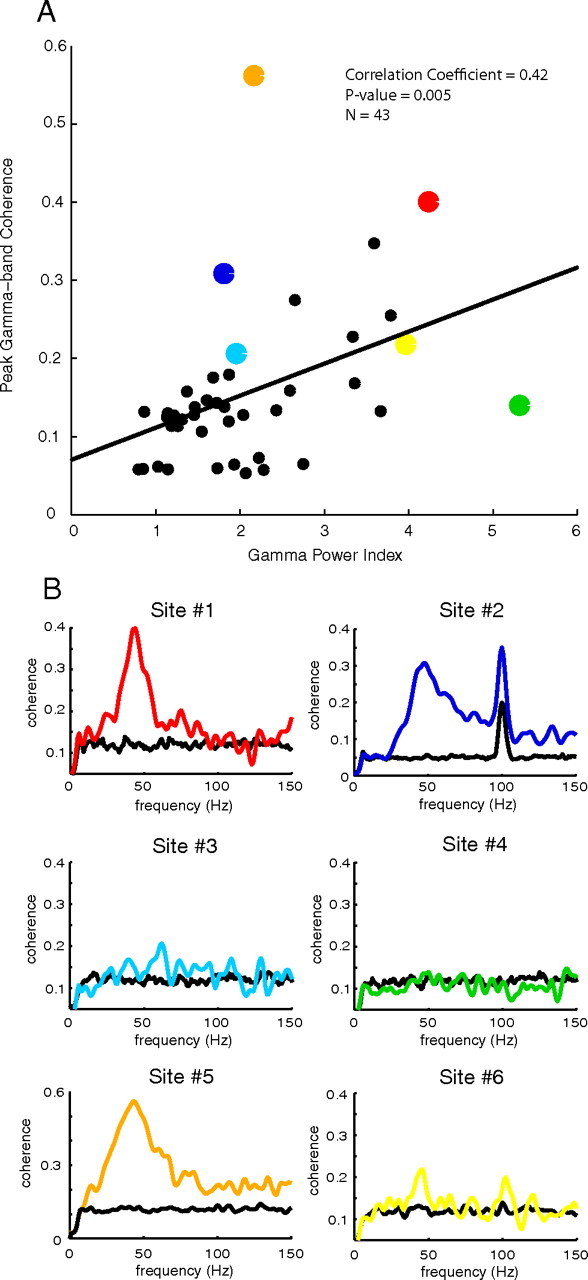
The local field potential (LFP) and multiunit activity (MUA) are extracellularly recorded signals that describe local neuronal network dynamics. In our experiments, the LFP and MUA, recorded from the same electrode in macaque primary visual cortex V1 in response to drifting grating visual stimuli, were evaluated on coarse timescales (∼1-5 s) and fine timescales (<0.1 s). On coarse timescales, MUA and the LFP both produced sustained visual responses to optimal and non-optimal oriented visual stimuli. The sustainedness of the two signals across the population of recording sites was correlated (correlation coefficient, ∼0.4). At most recording sites, the MUA was at least as sustained as the LFP and significantly more sustained for optimal orientations. In previous literature, the blood oxygen level-dependent (BOLD) signal of functional magnetic resonance imaging studies was found to be more strongly correlated with the LFP than with the MUA as a result of the lack of sustained response in the MUA signal. Because we found that MUA was as sustained as the LFP, MUA may also be correlated with BOLD. On fine timescales, we computed the coherence between the LFP and MUA over the frequency range 10-150 Hz. The LFP and MUA were weakly but significantly coherent (∼0.14) in the gamma band (20-90 Hz). The amount of gamma-band coherence was correlated with the power in the gamma band of the LFP. The data were consistent with the proposal that the LFP and MUA are generated in a noisy, resonant cortical network.


Conflict of interest statement

The authors declare no competing conflicts of interest.

Figures

Figure 1.
Figure 1.
A, Population average R-spectrum (stimulated power spectrum divided by spontaneous power spectrum; see Materials and Methods); the power spectrum of the response to visual stimulation is dominated by a peak in the gamma band centered around 40 Hz. B, Histogram of population maximum gamma-band (20–90 Hz) R-spectrum (>9 placed in hatched bin above 9). All sites had maximum R-spectrum values in the gamma band greater than 1, indicating a response to the stimulus.
Figure 2.
Figure 2.
Coarse timescale signal generation. MUA: Each trial is convolved with a Gaussian kernel whose width matches that used for the LFP spectrogram, and the site average is found by averaging all Gaussian kernel smoothed trial MUA recordings, RFP: For each trial, the MUA is formed by thresholding the RFP at 3 SDs and recording binary spikes in a separate file when large-amplitude transients occur, and the LFP is formed by low-pass filtering the RFP at 500 Hz. LFP: The gamma-band power time series for each trial is formed by averaging the spectrogram of the LFP over the frequencies between 20 and 60 Hz; the site average gamma-band power time series is found by averaging over all gamma-band power time series from all trials at that site.
Figure 3.
Figure 3.
The population average MUA and LFP gamma-band power responses to optimal orientation stimuli (blue) and all oriented stimuli (red). A, Population average raw MUA responses. B, Population average raw LFP gamma-band power responses. C, Population average normalized MUA responses. D, Population averaged normalized LFP gamma-band power responses. The MUA is more narrowly tuned to angle of the drifting grating visual stimuli than the LFP gamma-band power, and the normalization of the signals does not qualitatively change the coarse timescale characteristics of the two signals.
Figure 4.
Figure 4.
Trial average MUA and LFP gamma power from one site. Plotted in green are the features of the LFP and MUA used in the SI of the two signals. SI = (μS − μB)/(peak − μB).
Figure 5.
Figure 5.
A, Scatter plot of sustained indices in response to optimally oriented stimuli with linear regression (dashed blue line) and reference unity line (solid blue line). Sites with MUAs that track the phase of the visual stimulus are surrounded by a square. There was a large amount of variability in the response of the LFP and MUA, but a majority of points lie above the unity line, indicating that more sites had MUAs that were more sustained than LFPs. B, Histograms of the population MUA and LFP sustained indices for optimal stimuli with mean and SD. On average, the MUA was more sustained then the LFP for stimuli at the optimal orientation. C, LFP and MUA responses of four example cells to optimal stimuli; the indices of these responses are color coded in the scatter plot. A wide variety of responses are seen for both the MUA and LFP at individual sites.
Figure 6.
Figure 6.
A, Scatter plot of the sustained indices of the MUA and LFP in response to stimuli oriented to give the maximum gamma-band LFP response with linear regression (dashed black line) and reference unity line (solid blue line). B, Histograms of the population MUA and LFP sustained indices for optimal LFP oriented stimuli with mean. The relationship between the sustained indices of the MUA and LFP and the population means are not qualitatively changed when optimal LFP stimuli are used rather than optimal MUA stimuli as in Figure 5.
Figure 7.
Figure 7.
A, Scatter plot of sustained indices in response to all oriented stimuli with linear regression (dashed blue line) and reference unity line (solid blue line). B, Histograms of the population MUA and LFP sustained indices for all oriented stimuli with mean and SD. When all orientations are included, the mean MUA and LFP response are nearly equal.
Figure 8.
Figure 8.
A, Scatter plot of the sustained indices of the MUA at the MUA optimal response orientations compared with the 100 Hz power index. B, Scatter plot of the sustained indices of the LFP at the MUA optimal response orientations compared with the 100 Hz power index.
Figure 9.
Figure 9.
A, Coherence between the LFP and MUA with shift-predictor coherence: LFP–MUA coherence (black), mean shift-predictor coherence (green), and 95th percentile of the shift predictor coherence (blue). The regions of statistically significant coherence occur when the coherence exceeds the 95th percentile of the shift-predictor coherence. B, Histograms of the maximum coherence of each experiment (left) and of the frequency at which the maximum coherence occurs (right) C, Polar plot of the average maximum coherence as a function of frequency (angle, frequency; radius, average maximum coherence). The largest maximum coherences are associated with gamma-band frequencies (30–50 Hz), with weaker maximum coherence at 100 Hz (monitor refresh rate).
Figure 10.
Figure 10.
A, A scatter plot of the GPI and the maximum gamma-band coherence; the coherence in the gamma band increases as the gamma-band power increases. B, Example sites color coded with their corresponding points in the scatter plot (95th percentile of the shift predictor for each site is plotted in black).

Similar articles

Cited by

References

    1. Almeida R, Stetter M. Modeling the link between functional Imaging and neuronal activity: synaptic metabolic demand and spike rates. Neuroimage. 2002;17:1065–1079. - PubMed
    1. Angenstein F, Kammerer E, Scheich H. The BOLD response in the rat hippocampus depends rather on local processing of signals than on the input or output activity. A combined functional MRI and electrophysiological study. J Neurosci. 2009;29:2428–2439. - PMC - PubMed
    1. Belitski A, Gretton A, Magri C, Murayama Y, Montemurro MA, Logothetis NK, Panzeri S. Low-frequency local field potentials and spikes in primary visual cortex convey independent visual information. J Neurosci. 2008;28:5696–5709. - PMC - PubMed
    1. Ben-Yishai R, Bar-Or RL, Sompolinsky H. Theory of orientation tuning in visual cortex. Proc Natl Acad Sci U S A. 1995;92:3844–3848. - PMC - PubMed
    1. Burns SP, Xing D, Shelley MJ, Shapley RM. Searching for autocoherence in the cortical network with a time-frequency analysis of the local field potential. J Neurosci. 2010;30:4033–4047. - PMC - PubMed

Publication types

LinkOut - more resources