. 2010 Oct 13;30(41):13774-83.
doi: 10.1523/JNEUROSCI.0091-10.2010.

REEP2 enhances sweet receptor function by recruitment to lipid rafts

Affiliations

REEP2 enhances sweet receptor function by recruitment to lipid rafts

Erwin Ilegems et al. J Neurosci. .

Abstract

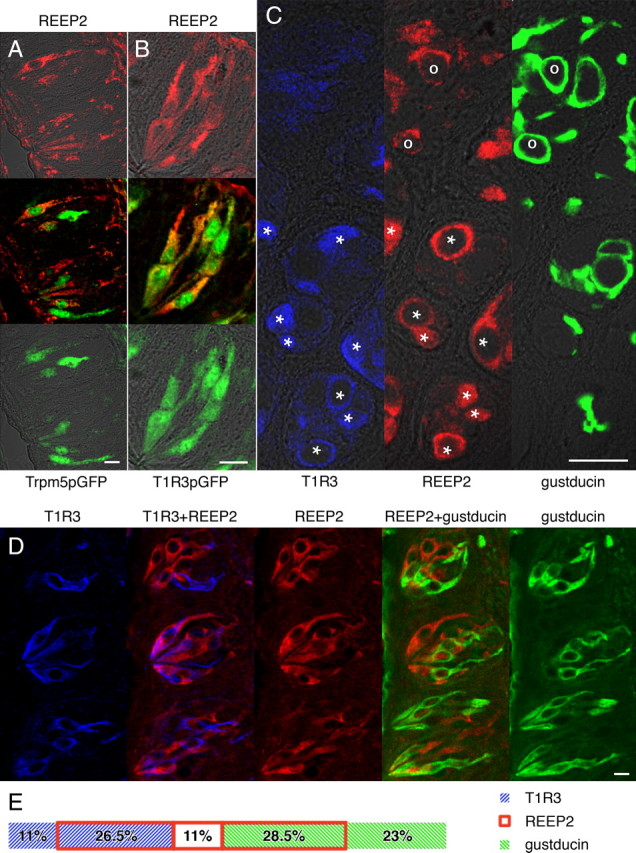
Heterologously expressed sensory receptors generally do not achieve the ligand sensitivity observed in vivo, and may require specific accessory proteins to ensure optimal function. We searched for taste cell-expressed receptor transporting protein (RTP) and receptor expression enhancing protein (REEP) family members that might serve as accessory molecules to enhance gustatory receptor function. We determined that REEP2 is an integral membrane protein expressed in taste cells, physically associates with both subunits of the type 1 taste receptor 2 and type 1 taste receptor 3 sweet receptor and specifically enhances responses to tastants of heterologously expressed sweet and bitter taste receptors. Downregulation of endogenously expressed REEP2 in the chemosensory enteroendocrine GLUTag cell line dramatically reduced sensitivity of endogenous sweet receptors. In contrast to the observation that RTP1, RTP2, and REEP1 enhance function of olfactory receptors by promoting their transit to the cell surface, we found that REEP2 does not increase cell surface expression of sweet receptors but instead alters their spatial organization. REEP2 recruits sweet receptors into lipid raft microdomains localized near the taste cell's apical region, thereby improving G-protein-coupled receptor signaling and promoting receptor access to tastants arriving through the apical taste pore.


Figures

Figure 1.
Figure 1.
Expression of REEP2 in taste cells. A, PCR amplification (25 cycles) of REEP2 and GAPDH (control) from mouse cDNAs from circumvallate (CV) taste cells vs surrounding non-taste epithelial cells shows preferential expression of REEP2 in taste cells. B, Quantitative real-time PCR using probes for detection of REEP2 and GAPDH confirms that REEP2 mRNA is more highly expressed in circumvallate papillae taste cells vs surrounding non-taste epithelial cells. Error bars show SD. C–E, Immunofluorescence confocal microscopy with an anti-REEP2 antibody shows expression of REEP2 in taste cells from the circumvallate (C), fungiform (D), and foliate (E) papillae. Scale bars, 50 μm.
Figure 2.
Figure 2.
Responsiveness of T1R and T2R taste receptors is enhanced by REEP2. A, Maximum calcium mobilization in response to ligand application was measured in control transfected (−) and REEP2-transfected (+) cells. HEK293E and GLUTag cells were transiently transfected with plasmids encoding the fluorescent calcium sensor YC3.60 (Nagai et al., 2004), either with (solid lines) or without REEP2 (dashed lines), along with either: mT1R2 + mT1R3 + the Gα16gus44 reporter G-protein (Jiang et al., 2005); hT2R16 + Gα16gus44, hT2R44 + Gα16gus44; 5-HT1AR + Gα16i3; 5-HT3R for HEK293E cells, or with Gα16gus44 for GLUTag cells. Calcium mobilization was undetectable in GLUTag cells not overexpressing REEP2. Preincubation of GLUTag cells for 15 min with the sweet taste receptor inhibitor gurmarin (3 μg/ml) (Ninomiya and Imoto, 1995; Margolskee et al., 2007) abolished the cellular response to sucralose. Calcium mobilization traces of representative experiments are presented above the graphs, normalized to the highest intracellular calcium increase. Arrows on traces indicate ligand application, horizontal time frame bar represents 20 s. B–D, Endogenously expressed REEP2 promotes activity of endogenously expressed sweet taste receptors in GLUTag cells. B, Western blot using anti-REEP2 antibody shows that REEP2 is endogenously expressed in GLUTag cells. C, siRNA transfection downregulates REEP2 expression in GLUTag cells. PCR (25 cycles) of REEP2 and GAPDH (control) showed a strong downregulation of REEP2 mRNA in GLUTag cells transfected with siRNA targeting REEP2 (compare with nontransfected or control siRNA-transfected cells). D, The sweet tastant sucralose induces enhanced secretion of GLP-1 from nontransfected and control transfected GLUTag cells, as measured by ELISA after 1 h incubation at 37°C. REEP2-targeted siRNA transfection in GLUTag cells eliminated the sweetener-stimulated increase in GLP-1 secretion above baseline. Gastric inhibitory peptide (GIP) is a potent trigger of GLP-1 release from GLUTag cells (Brubaker et al., 1998) and was used as a positive control: GLP-1 secretion in response to GIP was similar in REEP2 siRNA-treated cells compared with nontransfected or control siRNA-transfected cells, demonstrating that siRNA transfection does not alter secretion of GLP-1 per se. Baseline, sucralose-stimulated, and GIP-stimulated GLP-1 secretions are represented by white, gray, and black bars, respectively. Ligand concentrations were as follows: 30 mm glucose, 20 mm sucralose, 10 mm phenyl-β-d-glucopyranoside (PheβGlc), 10 mm saccharin, 10 μm serotonin, 100 μm serotonin, 100 nm GIP. Averaged values of experiments done three times in triplicate are shown; values are means ± SD, *p < 0.05, **p < 0.01, ***p < 0.001.
Figure 3.
Figure 3.
Coexpression of REEP2 with taste signaling elements in taste cells. Confocal microscopy was used to detect REEP2 and taste-specific signaling molecules in taste cells from circumvallate papillae. A, B, Coexpression of REEP2 (red, top panels) with Trpm5 and T1R3 (green, bottom panels), as seen by double immunofluorescence staining using rabbit anti-REEP2 and goat anti-GFP antibodies with taste cells derived from transgenic mice expressing GFP under the Trpm5 promoter (A, Trpm5pGFP) or the T1R3 promoter (B, T1R3pGFP). Top and bottom panels are confocal overlays of fluorescent and transmission channels, middle panels are overlays of red and green fluorescent channels. C, D, Coexpression of REEP2 with T1R3, and of REEP2 with gustducin, as seen by single immunofluorescence staining of three serial transverse (C), or three serial longitudinal (D) sections. Rabbit anti-gustducin labeling is shown in green, rabbit anti-REEP2 in red and rabbit anti-T1R3 in blue. In C, Cells coexpressing gustducin and REEP2 are marked by “o”, cells coexpressing T1R3 and REEP2 are marked by *. Double images in D are overlays of green/red images (REEP2+gustducin) or red/blue images (T1R3+REEP2). E, Expression distribution in taste cells from circumvallate papillae, shown as a percentage of the total number of cells labeled by immunofluorescence (n = 159). Section thicknesses were 5 μm (A, B, D) or 4 μm (C). Scale bars, 20 μm.
Figure 4.
Figure 4.
Plasma membrane topology of REEP2. The topology of REEP2 was assessed by epitope accessibility. A, B, REEP2 was labeled with an HA tag either at the C terminus (A) or N terminus just after the predicted signal sequence (B), giving the functionally active proteins REEP2-HA and HA-REEP2, respectively. Anti-HA antibody accessibility of the HA tag was determined by fluorescence confocal microscopy in nonpermeabilized cells 2 d after transient transfection in HEK293E. The C-terminal HA tag on REEP2-HA was not accessible (A), while the N-terminal HA tag on HA-REEP2 was accessible (B) as shown by the red fluorescent labeling clustered at the cell surface. C, Topological orientation of REEP2 in the plasma membrane, as deduced from the above experiments. D, Subcellular localization of REEP2 within CV taste cells as determined by immunoelectron microscopy indicated that REEP2 is associated with the plasma membrane. Seventy-nanometer-thin sections of CV papillae were prepared and incubated with anti-REEP2 antibody and gold-conjugated secondary antibody. Transmission electron microscopy imaging was performed in a region near the apical taste pore (inset), and REEP2 immunoreactivity was observed to be present intracellularly ∼50 nm below the plasma membrane (main image, enlargement of box domain in inset). White arrows indicate gold labels, yellow dashed lines indicate plasma membrane. The panel is oriented such that the taste pore is toward the top. SP, Signal peptide; TM, transmembrane domain; LZ, leucine zipper domain; star, HA tag location, DM, desmosome, I, intercellular space. Scale bars: (A, B), 10 μm; (D), 500 nm.
Figure 5.
Figure 5.
REEP2 recruits T1R receptors to lipid rafts. A, Cell surface proteins from transfected HEK293E cells expressing mT1R2-FLAG and mT1R3-HA in the presence (rows 1, 3) or absence (rows 2, 4) of REEP2 were biotinylated, isolated, electrophoresed in polyacrylamide gels and transferred to PVDF membranes. Western blots probed with anti-FLAG, anti-HA, or anti-REEP2 antibodies showed that the presence of REEP2 did not increase cell surface expression of T1R2 or T1R3 receptors, nor did it affect their expression among total cell protein. B, Lipid raft proteins from transfected HEK293E cells expressing mT1R2-FLAG, mT1R3-HA and actin-EYFP in the presence (rows 1, 3) or absence (rows 2, 4) of REEP2 were isolated (see supplemental Fig. 6, available at www.jneurosci.org as supplemental material). Western blots probed with antibodies against FLAG and HA, and dot blots probed with antibodies against GFP, integrin-β1 and REEP2 showed that the presence of REEP2 increased accumulation of both T1R2 and T1R3 in lipid rafts. In contrast, expression of both sweet receptor subunits among total cellular protein was unaffected by the presence of REEP2. Expression of actin-EYFP serves as a normalization marker for each preparation and is independent on the presence or absence of REEP2. Note that actin filaments—known to be associated with lipid rafts (Bodin et al., 2005; Taguchi et al., 2005)—were also found in isolated lipid rafts, while the membrane protein integrin-β1—excluded from lipid rafts (Bodin et al., 2005)—was not. C, D, Projection of consecutive confocal images covering a 7 μm tissue section illustrates the distribution of REEP2 within the taste bud. D, Overlay of red and transmission channels indicates that REEP2 is more highly expressed near the taste bud pore region, suggesting a role in the spatial organization of taste receptors to the apical domain (arrows). E, REEP2 localization was quantified from the apical to the basal side of 7 distinct taste buds in 2-mm-thick longitudinal sections by immunostaining, showing the abundance of REEP2 proteins in proximity to the apical pore. REEP2 was detected using an anti-REEP2 antibody and indirect immunofluorescence (red). Representative data are presented. Scale bar, 10 μm.

Similar articles

Cited by

References

    1. Baker EK, Colley NJ, Zuker CS. The cyclophilin homolog NinaA functions as a chaperone, forming a stable complex in vivo with its protein target rhodopsin. EMBO J. 1994;13:4886–4895. - PMC - PubMed
    1. Behrens M, Meyerhof W. Bitter taste receptors and human bitter taste perception. Cell Mol Life Sci. 2006;63:1501–1509. - PMC - PubMed
    1. Behrens M, Bartelt J, Reichling C, Winnig M, Kuhn C, Meyerhof W. Members of RTP and REEP gene families influence functional bitter taste receptor expression. J Biol Chem. 2006;281:20650–20659. - PubMed
    1. Bendtsen JD, Nielsen H, von Heijne G, Brunak S. Improved prediction of signal peptides: SignalP 3.0. J Mol Biol. 2004;340:783–795. - PubMed
    1. Bodin S, Soulet C, Tronchère H, Sié P, Gachet C, Plantavid M, Payrastre B. Integrin-dependent interaction of lipid rafts with the actin cytoskeleton in activated human platelets. J Cell Sci. 2005;118:759–769. - PubMed

Publication types