. 2010 Oct 13;30(41):13784-93.
doi: 10.1523/JNEUROSCI.1191-10.2010.

Membrane anchoring subunits specify selective regulation of RGS9·Gbeta5 GAP complex in photoreceptor neurons

Affiliations

Membrane anchoring subunits specify selective regulation of RGS9·Gbeta5 GAP complex in photoreceptor neurons

Yan Cao et al. J Neurosci. .

Abstract

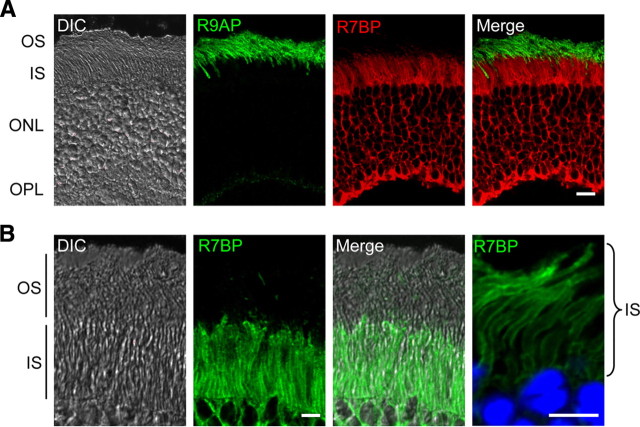
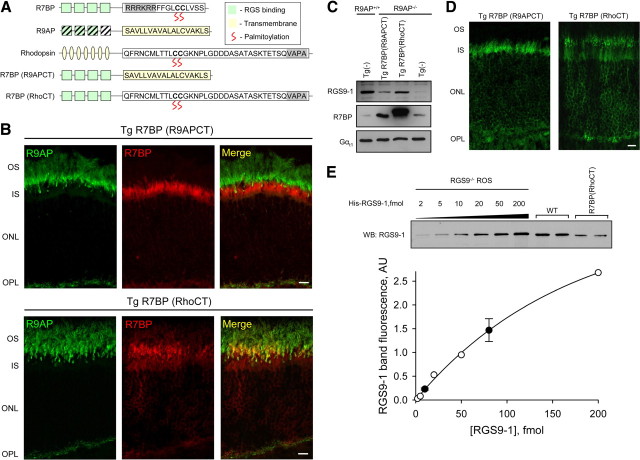
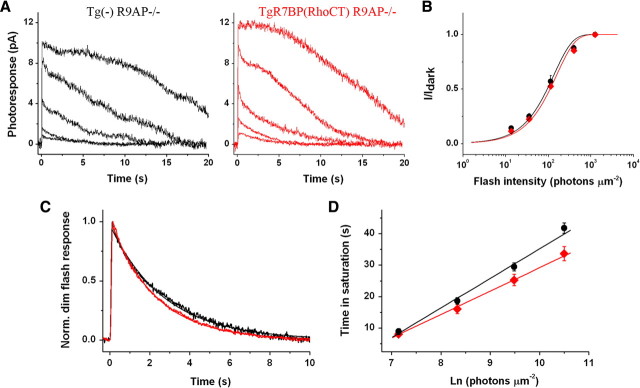
The RGS9·Gβ5 complex is the key regulator of neuronal G-protein signaling and shows remarkable selectivity of subunit composition. In retinal photoreceptors, RGS9·Gβ5 is bound to the membrane anchor R9AP and the complex regulates visual signaling. In the basal ganglia neurons, RGS9·Gβ5 is instead associated with a homologous protein, R7BP, and regulates reward circuit. Switching this selective subunit composition of the complex in rod photoreceptors allowed us to study the molecular underpinning of signaling specificity in diverse G-protein pathways. We have found that both membrane anchoring subunits play a conserved role in regulating protein levels of RGS9·Gβ5 and enhancing the ability of RGS·Gβ5 complexes to stimulate GTPase activity of G proteins. However, notable differences exist in the subcellular targeting of alternatively configured complexes. Unlike R9AP, which relies on passive targeting mechanisms for the delivery to the outer segments of the photoreceptors, R7BP is excluded from this location and is instead specifically targeted to the plasma membrane. R7BP-containing complexes could be rerouted to the outer segments, where they are capable of regulating the phototransduction cascade by the active targeting signals derived from rhodopsin. These findings illustrate the diversity of the G-protein signaling regulation by RGS·Gβ5 complexes achieved by differential recruitment of the membrane anchors.


Figures

Figure 1.
Figure 1.
Transgenic expression of R7BP in rod photoreceptors. A, Top, Schematics of the genetic construct used to target R7BP expression to rod photoreceptors. Bottom, Ultrathin sections of plastic-embedded retinas from 2-month-old transgenic (Tg R7BP) and nontransgenic littermates [Tg(−)] showing normal retina morphology. Scale bar is 25 μm. B, Immunohistochemical detection of R7BP expression in cross-sections of retinas from transgenic mice that express either high [R7BP(H)] or low [R7BP(L)] levels of R7BP compared with nontransgenic littermates. OS, Outer segment; IS, inner segment; ONL, outer nuclear layer; OPL, outer plexiform layer; INL, inner nuclear layer; IPL, inner plexiform layer; GC, ganglion cell layer. Scale bar is 20 μm. C, Analysis of protein expression in the retinas of transgenic mice by Western blotting. Into each lane was loaded 8.5 μg of total protein and the blots were probed with the indicated antibodies. D, Quantification of the Western blot data presented in C. Protein band intensities were determined by Odyssey infrared imaging system software package. Values from three independent experiments were averaged and plotted after normalization to the levels found in nontransgenic animals. Error bars represent SEM values.
Figure 2.
Figure 2.
R9AP and R7BP compete for binding to RGS9-1 in transgenic retinas. A, Analysis of protein levels in transgenic retinas before and after RGS9-1 immunoprecipitation. Lower amounts of R9AP coprecipitate with RGS9-1 in transgenic retinas containing higher levels of R7BP. All retinas are from mice of R9AP+/− background. B, Quantification of data presented in A. The ratios between R9AP and RGS9-1 band intensities in the eluate fractions after immunoprecipitation are plotted. Error bars represent SEM values. **p < 0.01, t test; statistically significant difference in ratios compared with nontransgenic littermates.
Figure 3.
Figure 3.
Differential targeting of R7BP and R9AP in rods. A, Immunohistochemical analysis of R7BP and R9AP localization in photoreceptors of R7BP(H) transgenic mice. Retinas were double stained with R7BP (red) and R9AP (green) antibodies, as described in Materials and Methods, and fluorescence was determined by confocal microscopy. Scale bar is 10 μm. B, Higher magnification of photoreceptor outer and inner segment region showing exclusive plasma membrane localization of R7BP in the inner segment. Nuclei are labeled by DAPI and appear in blue channel. Scale bar is 5 μm. OS, Outer segment; IS, inner segment; ONL, outer nuclear layer; OPL, outer plexiform layer; DIC, differential interference contrast.
Figure 4.
Figure 4.
Critical role of R7BP and R9AP in targeting RGS9-1·Gβ5 to alternative locations in photoreceptors. A, Western blotting analysis of the protein expression in transgenic retinas of R9AP−/− background. Transducin (Gαt1) detection was used as the loading control. B, Quantification of data presented in A showing that expression of transgenic R7BP can rescue proteolytic instability of RGS9-1 in R9AP−/− retinas. RGS9-1 band intensities were normalized to Gαt1 content and reflected as fold change over RGS9-1 present in transgenic-negative R9AP+/+ (wild-type) samples. C, Expression of R7BP in R7BP transgenic retina delocalized RGS9-1 from the outer segments of photoreceptors. Retina cross-sections were immunostained with anti-RGS9-1 antibodies as described in Materials and Methods. Scale bar is 10 μm. OS, Outer segment; IS, inner segment; ONL, outer nuclear layer; OPL, outer plexiform layer.
Figure 5.
Figure 5.
Reconstitution of the RGS9-1·Gβ5·R7BP complex in the outer segments of the rod photoreceptors. A, Schematic illustration of targeting signals replaced in R7BP. The C terminus of R7BP was replaced by either the C-terminal signal sequence from rhodopsin [R7BP(RhoCT)] or from R9AP [R7BP(R9APCT)]. Constructs were used to generate transgenic mice. B, Localization of chimeric R7BP proteins in transgenic photoreceptors. Retinas were double stained for R7BP and R9AP. R9AP staining was used as a marker for the outer segments. Colocalization of proteins is revealed by yellow fluorescence when overlaying the green (R9AP) and red (R7BP) detection channels. Images were obtained by confocal microscopy. Scale bar is 10 μm. C, Expression of chimeric R7BP constructs rescues RGS9-1 levels in R9AP−/− retinas. Protein expression was analyzed by Western blotting with indicated antibodies. D, RGS9-1 is delivered to the outer segments of R7BP(RhoCT) transgenic mice but remains primarily in the inner segments of R7BP(R9APCT) photoreceptors. Retina cross-sections were stained with the antibodies against RGS9-1 and fluorescence was detected by confocal microscopy. Scale bar is 10 μm. E, Quantification of RGS9-1 content in the outer segments isolated from transgenic retinas by Western blotting. Varying amounts of purified recombinant RGS9-1·Gβ5 protein were spiked into outer segments isolated from RGS9−/− retinas (5 pmol of rhodopsin/lane) and RGS9-1 band intensities were determined by Western blotting in parallel with the outer segment samples obtained from transgenic and wild-type mice. Values obtained from recombinant RGS9-1 band intensities (open circles) were used to generate a standard curve. RGS9-1 band intensities from the samples in question: wild type (WT) and R7BP(RhoCT) were plotted on the calibration curve (closed circles) and used to determine RGS9-1 concentration. The experiment was performed two times. Error bars represent the scatter of the data. OS, Outer segment; IS, inner segment; ONL, outer nuclear layer; OPL, outer plexiform layer.
Figure 6.
Figure 6.
RGS9-1·Gβ5·R7BP complex accelerates the shutoff of the light responses. A, Families of flash responses from representative transgenic-negative R9AP−/− (black) and R7BP(RhoCT) transgenic (red) rods. Light test flashes (500 nm) were delivered at time 0, with intensities of 14, 35, 112, 399, and 1265 photons μm−2. For the representative cells shown, dark currents were 10.1 and 11.9 pA. B, Normalized averaged intensity-response relations. Points were fitted with saturating exponential functions. Data are means ± SEM. C, Determination of the dim flash recovery time constant. The responses were normalized to their maximum amplitudes and population-averaged (noisy lines). Light intensity for all cells was 35 photons μm−2. Thin solid lines are single-exponential fits to the falling phase of responses. D, Determination of the dominant time constant of recovery from a series of supersaturating flashes. Straight lines are linear fits. For parameters of fits in BD see Table 1. Data are means ± SEM.
Figure 7.
Figure 7.
R7BP acts to stimulate the GAP activity of R7 RGS proteins. A, GTPase activities in transgenic rod outer segments. Single-turnover GTPase activities of transducin in ROS preparations from wild-type, R9AP−/−, and R7BP(RhoCT)::R9AP−/− transgenic animals were measured as described in Materials and Methods. B, The rate constants of transducin GTPase activity were determined by exponential fits of the data presented in A and plotted as bars. The resulting kapp values were 0.078 ± 0.007 s−1 for wild-type, 0.040 ± 0.002 s−1 for R9AP−/−, and 0.050 ± 0.001 s−1 for R7BP(RhoCT)::R9AP−/−. C, Effects of recombinant R7BP on RGS7·Gβ5-stimulated GTPase activity of lipid-modified Gαo. Single-turnover GTPase activity of recombinant Gαo was measured by single-turnover assays. Intrinsic GTPase activities of Gαo in the presence of either empty Sf9 cell membranes or membranes expressing R7BP(R9APCT) were indistinguishable. However, when the reaction was supplemented with RGS7·Gβ5, GTPase activity was higher with the addition of the R7BP-containing membranes. Data were fitted with single exponents to derive the apparent rate constants (kapp). The kGAP values were obtained by subtracting the rates of the intrinsic GTPase activity of Gαo observed in the absence of RGS proteins and plotted in D. Error bars are means ± SEM.

Similar articles

Cited by

References

    1. Anderson GR, Posokhova E, Martemyanov KA. The R7 RGS protein family: multi-subunit regulators of neuronal G protein signaling. Cell Biochem Biophys. 2009;54:33–46. - PMC - PubMed
    1. Artemyev NO. Light-dependent compartmentalization of transducin in rod photoreceptors. Mol Neurobiol. 2008;37:44–51. - PubMed
    1. Baker SA, Martemyanov KA, Shavkunov AS, Arshavsky VY. Kinetic mechanism of RGS9-1 potentiation by R9AP. Biochemistry. 2006;45:10690–10697. - PubMed
    1. Baker SA, Haeri M, Yoo P, Gospe SM, 3rd, Skiba NP, Knox BE, Arshavsky VY. The outer segment serves as a default destination for the trafficking of membrane proteins in photoreceptors. J Cell Biol. 2008;183:485–498. - PMC - PubMed
    1. Blundell J, Hoang CV, Potts B, Gold SJ, Powell CM. Motor coordination deficits in mice lacking RGS9. Brain Res. 2008;1190:78–85. - PMC - PubMed

Publication types