. 2010 Oct 13;30(41):13895-905.
doi: 10.1523/JNEUROSCI.2320-10.2010.

Slow degradation and aggregation in vitro of mutant GABAA receptor gamma2(Q351X) subunits associated with epilepsy

Affiliations

Slow degradation and aggregation in vitro of mutant GABAA receptor gamma2(Q351X) subunits associated with epilepsy

Jing-Qiong Kang et al. J Neurosci. .

Abstract

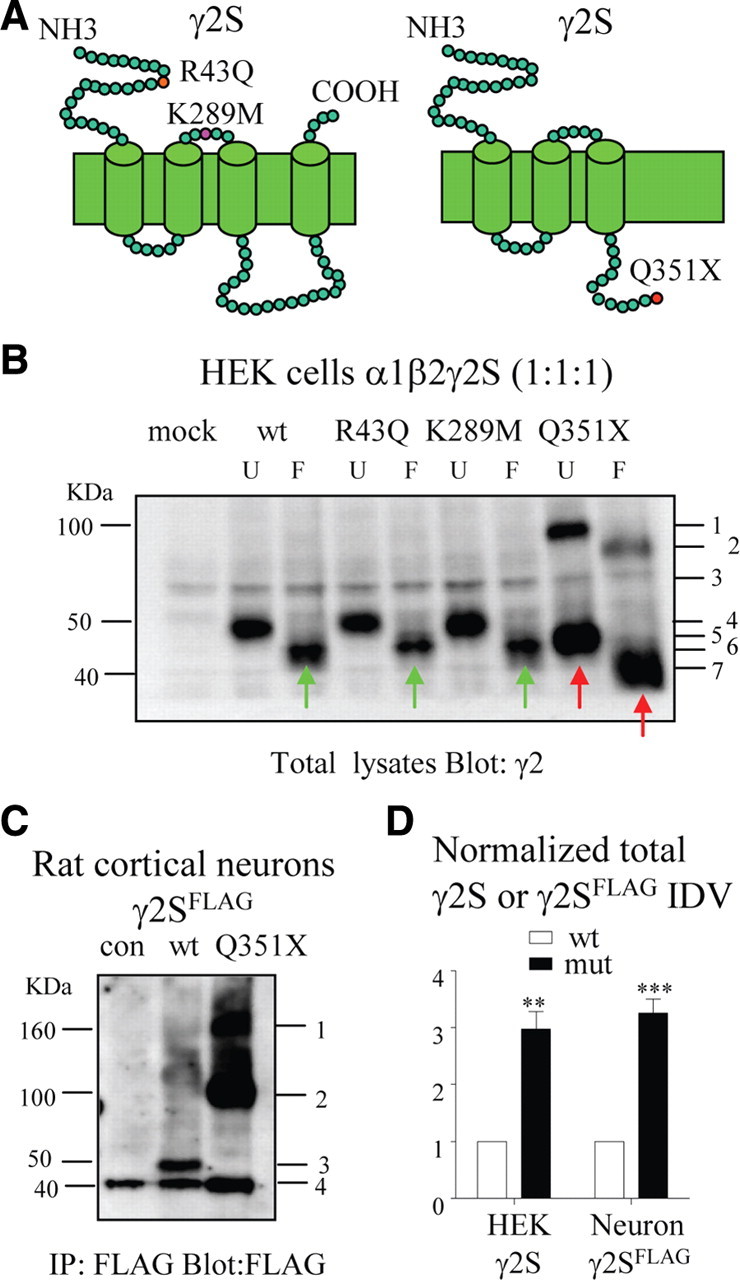
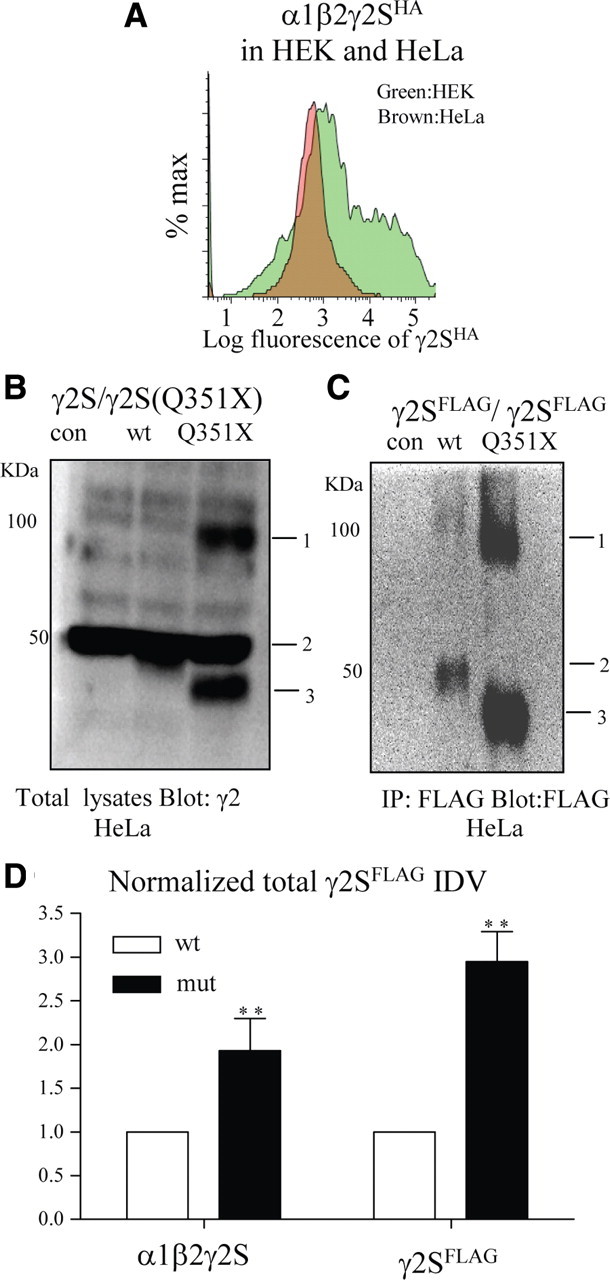
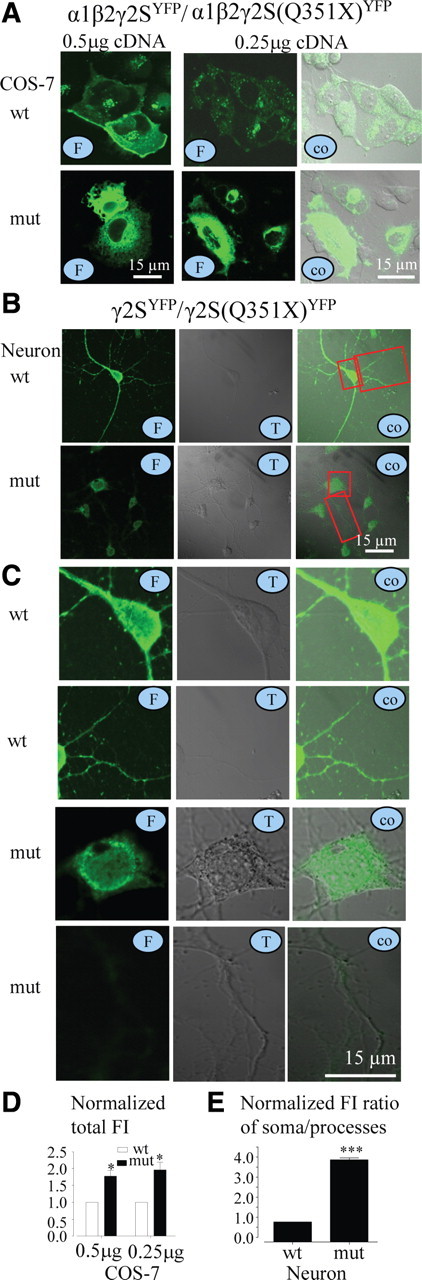
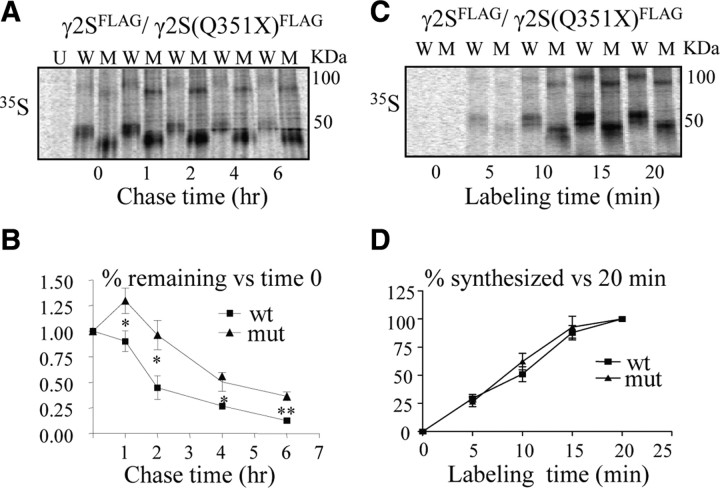
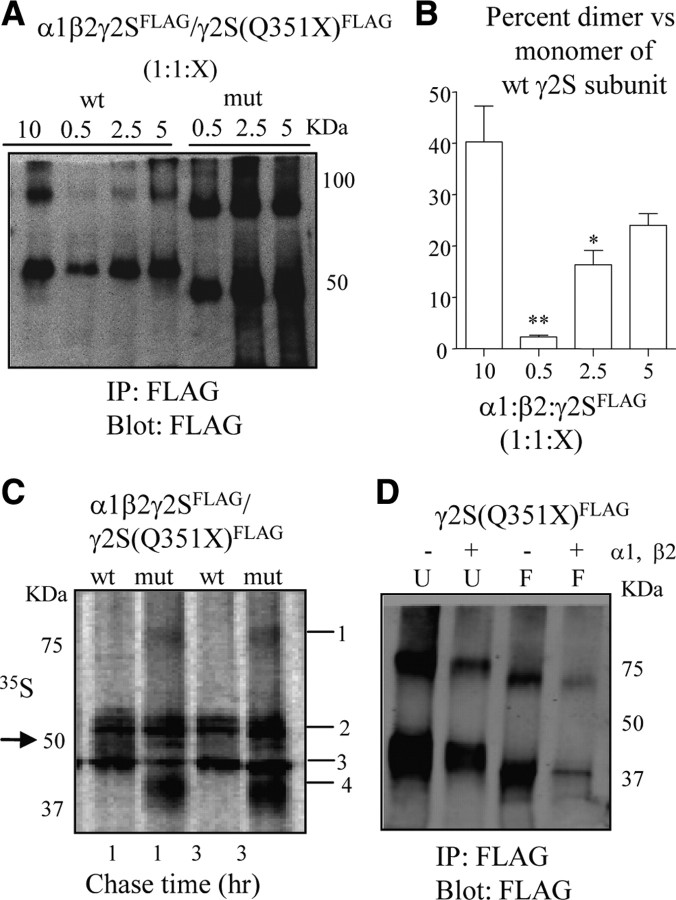
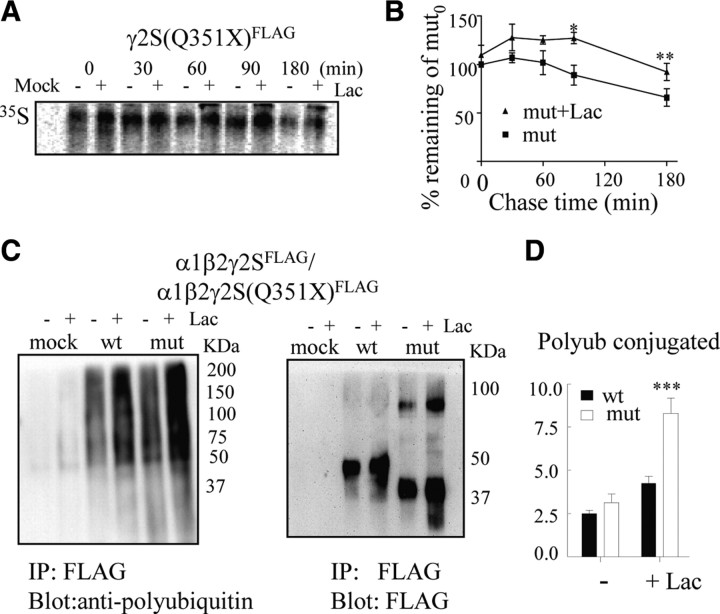
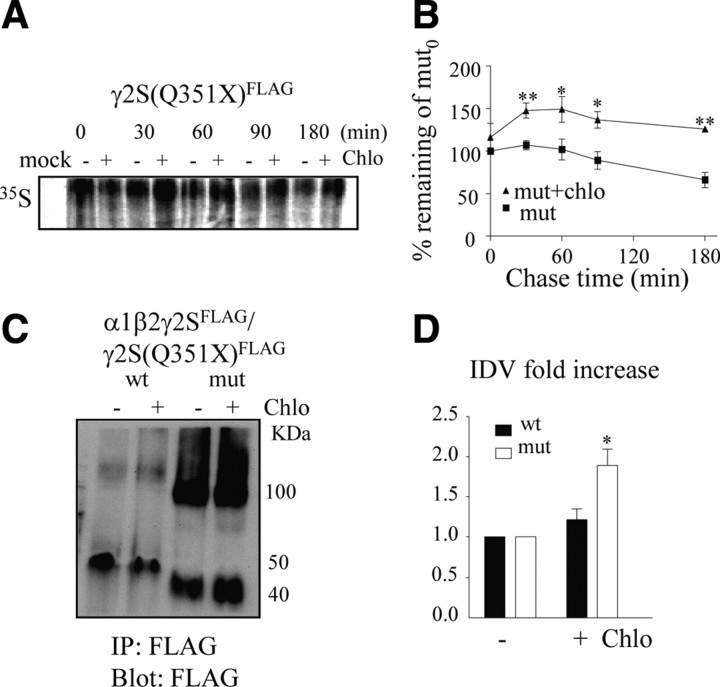
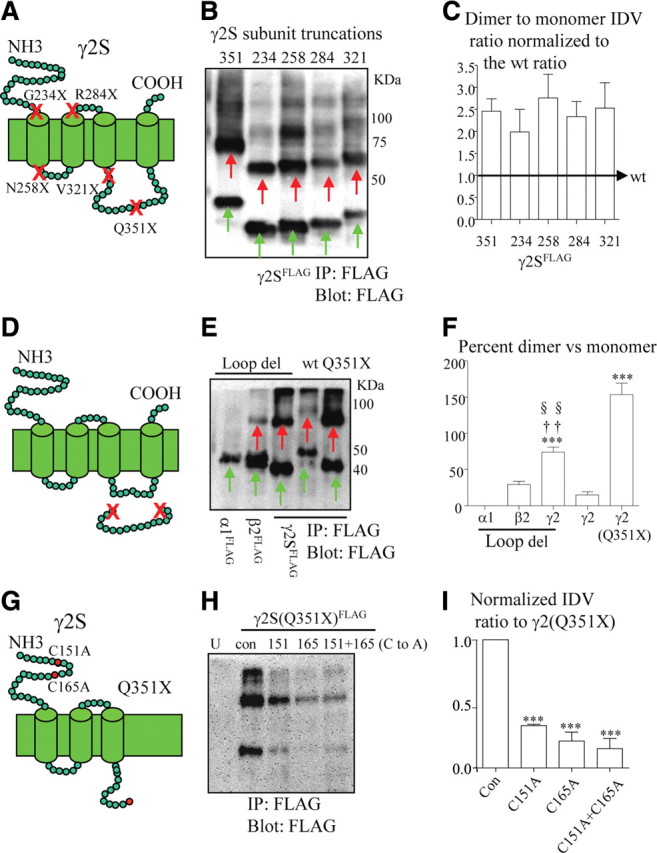
The GABA(A) receptor γ2 subunit nonsense mutation Q351X has been associated with the genetic epilepsy syndrome generalized epilepsy with febrile seizures plus, which includes a spectrum of seizures types from febrile seizures to Dravet syndrome. Although most genetic epilepsy syndromes are mild and remit with age, Dravet syndrome has a more severe clinical course with refractory seizures associated with developmental delay and cognitive impairment. The basis for the broad spectrum of seizure phenotypes is uncertain. We demonstrated previously that the GABA(A) receptor γ2 subunit gene Q351X mutation suppressed biogenesis of wild-type partnering α1 and β2 subunits in addition to its loss of function. Here we show that γ2S(Q351X) subunits have an additional impairment of biogenesis. Mutant γ2(Q351X) subunits were degraded more slowly than wild-type γ2 subunits and formed SDS-resistant, high-molecular-mass complexes or aggregates in multiple cell types, including neurons. The half-life of γ2S(Q351X) subunits was ∼4 h, whereas that of γ2S subunits was ∼2 h. Mutant subunits formed complexes rapidly after synthesis onset. Using multiple truncated subunits, we demonstrated that aggregate formation was a general phenomenon for truncated γ2S subunits and that their Cys-loop cysteines were involved in aggregate formation. Protein aggregation is a hallmark of neurodegenerative diseases, but the effects of the mutant γ2S(Q351X) subunit aggregates on neuronal function and survival are unclear. Additional validation of the mutant subunit aggregation in vivo and determination of the involved signaling pathways will help reveal the pathological effects of these mutant subunit aggregates in the pathogenesis of genetic epilepsy syndromes.


Figures

Figure 1.
Figure 1.
Mutant γ2S(Q351X) subunits self aggregated and formed high-molecular-mass protein complexes. A, Schematic topologies of wild-type and mutant γ2S subunits are presented. The red dots represent the locations of the γ2S subunit mutations R43Q, K289M, and Q351X. B, Total lysates (30 μg) from cells mock transfected with “empty” plasmids (mock) or with wild-type (wt) or mutant α1β2γ2S subunits were analyzed by immunoblot using a polyclonal rabbit anti-γ2 subunit antibody. Bands 1 and 2 are the PNGase F untreated (U, band 1) or treated (F, band 2) high-molecular-mass protein complexes. Band 3 is a nonspecific band detected with the polyclonal rabbit anti-γ2 subunit antibody. Bands 4 and 6 are PNGase F untreated (U, band 4) or treated (F, band 6, green arrows) monomeric wild-type γ2S and mutant γ2S(R43Q) or γ2S(K289M) subunits. Bands 5 and 7 are PNGase F untreated (U, band 5, red arrow) or treated (F, band 7) monomeric mutant γ2S(Q351X) subunits. C, Rat cortical neurons untransfected (con) or transfected with γ2SFLAG (wt) or γ2S(Q351X)FLAG (Q351X) subunits were lysed, immunopurified with anti-FLAG antibody, and analyzed by SDS-PAGE with anti-FLAG antibody. Bands 1 and 2 are the high-molecular-mass protein complexes that migrated at ∼160 kDa (band 1) and ∼80 kDa (band 2). Band 3 is the monomeric wild-type γ2SFLAG subunit, and band 4 is a nonspecific band that overlapped the monomeric mutant γ2S(Q351X)FLAG subunits. D, The total IDVs of both γ2S or γ2S(Q351X) subunits in HEK 293T cells (HEK) or γ2SFLAG or γ2S(Q351X)FLAG subunits in neurons (Neuron) were measured by subtracting the control band or the equivalent area if there was no distinct band. Both the lower- and higher-molecular-mass bands were included. The IDVs of the wild-type subunits were then taken as 1. The total IDVs of the mutant subunits were then normalized to the wild-type subunits (n = 4 for both HEK and Neuron; **p < 0.01; ***p < 0.001 vs wild type).
Figure 2.
Figure 2.
γ2S(Q351X) subunit protein aggregated and formed high-molecular-mass protein complexes in HeLa cells, which have low subunit expression. A, The flow cytometry histograms depict the total expression levels of γ2SHA subunits in either HEK 293T (green) or HeLa (brown) cells transfected with the same amounts of cDNAs as detected with fluorescently conjugated anti-human HA antibody (HA–Alexa Fluor-647). The total expression of γ2SHA subunits in HeLa cells was normalized to the γ2SHA in HEK 293T cells. B, C, HeLa cells were transfected with wild-type α1β2γ2S or mutant α1β2γ2S(Q351X) subunits (B) or with γ2SFLAG or γ2S(Q351X)FLAG subunits alone (C). At 48 h after transfection, the cells were lysed, and subunits in the lysates were either detected directly by SDS-PAGE (80 μg/lane) or were immunopurified with FLAG beads and then analyzed by SDS-PAGE using 1.5 mg of protein lysate per sample. In both B and C, band 1 is the high-molecular-mass protein complex that migrated at ∼160 kDa, and band 3 is the monomeric mutant γ2S(Q351X)FLAG subunit. In B, band 2 is a nonspecific band that overlapped the monomeric wild-type γ2S subunits, and in C, band 2 is the monomeric wild-type γ2SFLAG subunit. D, The total IDVs of γ2SFLAG or γ2S(Q351X)FLAG subunits when coexpressed with α1 and β2 subunits (left) or when expressed alone (right) in HeLa cells were measured by subtracting the control band or the equivalent area if there was no distinct band. Both lower- and higher-molecular-mass bands were included. The IDVs of wild-type subunits were then taken as 1. Expression of total wild-type protein was also taken as 1. The total IDVs of the mutant subunits were then normalized to the wild-type subunits (n = 4 for both B and C, **p < 0.01 vs wild type). con, Control; mut, Mutant; wt, wild type.
Figure 3.
Figure 3.
γ2S(Q351X)YFP subunit protein accumulated intracellularly in live cells. A, COS-7 cells were cotransfected with α1 and β2 subunits and wild-type γ2SYFP (wt) or mutant γ2S(Q351X)YFP (mut) subunits using the calcium phosphate precipitation method with different amounts of subunit cDNAs. Images were acquired 2 d after transfection. B, C, Cultured rat hippocampal neurons were cotransfected with wild-type γ2SYFP or mutant γ2S(Q351X)YFP subunits and were imaged using confocal microscopy 8 d after transfection. C, Enlarged views of wild-type and mutant receptors in neuronal somata and processes are shown in boxed areas in B. T, Transmitted image; wt, wild-type γ2SYFPsubunits; mut, mutant γ2S(Q351X)YFP subunits; co, colocalized images; F, fluorescent images. D, E, The total fluorescence intensities of cells were measured using the MetaMorph imaging software. In D, the total fluorescence from cells expressing wild-type γ2SYFP subunit-containing receptors (wt) was arbitrarily taken as 1, and the total fluorescence from cells expressing mutant γ2S(Q351X)YFP subunit-containing receptors (mut) was normalized to wild-type levels. In E, the total fluorescence of both neuronal somata and processes (including both axon and dendrites) were measured, and the fluorescence intensity ratios of the areas of the somata over processes were quantified. The fluorescence intensity (FI) ratios of wild-type subunits were arbitrarily taken as 1, and the fluorescence intensity ratios of mutant subunits were normalized to wild-type levels (n = 14–15 for COS-7 and n = 11 for neurons from four different transfections; *p < 0.05, ***p < 0.001 vs wt).
Figure 4.
Figure 4.
Mutant γ2S(Q351X) subunits formed dimers rapidly and were degraded slowly. A–D, [35S] pulse-labeled untransfected cells (U) or cells transfected with γ2SFLAG (W) or γ2S(Q351X)FLAG (M) subunits were lysed, immunopurified using anti-FLAG antibody, and analyzed by SDS-PAGE. A, B, After 20 min of labeling, cells were chased for the indicated times (A). The percentage radioactivity relative to the amounts of radioactivity measured at time 0 for the 100 and 50 kDa bands at each chase time were plotted for either wild-type or mutant subunits (B) (*p < 0.05, **p < 0.01 vs wild type; n = 5). C, D, Cells expressing γ2SFLAG or γ2S(Q351X)FLAG subunits were pulse labeled for the indicated times and lysed for immunopurification and SDS-PAGE (C). The percentage radioactivity incorporated during subunit synthesis for the 100 and 50 kDa bands at each labeling time was plotted by normalizing to the value obtained at 20 min for either wild-type or mutant subunits (D) (n = 4). Mut, Mutant; wt, wild type.
Figure 5.
Figure 5.
Wild-type γ2S subunits (wt) only formed high-molecular-mass protein complexes with coexpressed α1 and β2 subunits when they were in excess relative to α1 and β2 subunits, but mutant γ2S(Q351X) subunits (mut) formed high-molecular-mass protein complexes with or without coexpression of α1 and β2 subunits. A, Cells were cotransfected with α1, β2, and γ2SFLAG subunits at different cDNA ratios (1:1:10, 1:1:0.5, 1:1:2.5, or 1:1:5). The total amount of cDNA was normalized to the empty vector pcDNA. The immunopurified subunits were analyzed by immunoblot that was probed with an anti-FLAG antibody. B, The ratios of total IDVs of the higher molecular band (100 kDa) or the dimer band over the lower molecular band (50 kDa) or the monomer band in each condition were plotted (*p < 0.05, **p < 0.01 vs 1:1:10; n = 4). C, Cells coexpressing α1 and β2 subunits with wild-type γ2S and mutant γ2S(Q351X)FLAG subunits (cDNA ratio of 1:1:1) were pulse chased for 1 or 3 h and lysed for immunopurification and SDS-PAGE. Band 1 indicates the high-molecular-mass protein complex, and band 4 indicates γ2S(Q351X)FLAG subunit monomers. There were multiple bands in the band 2 area that indicate the wild-type γ2SFLAG and coimmunoprecipitated α1 and β2 subunits. Band 3 indicates a nonspecific band. The arrow points to the γ2SFLAG subunit band. D, Cells expressing mutant γ2S(Q351X)FLAG subunits alone (3 μg of cDNA) or coexpressed with α1 and β2 subunits (1 μg of cDNA each) were lysed for immunopurification, treated (F) or untreated (U) with PNGase F, and fractionated by SDS-PAGE (C and D were representative gels of four experiments).
Figure 6.
Figure 6.
Mutant γ2S(Q351X) subunits were degraded through the ubiquitin–proteasome pathway. A, Cells mock transfected (mock) or transfected with γ2S(Q351X)FLAG subunits were labeled with [35S]methionine for 20 min, followed by chase in the absence (−) or presence (+) of the proteasome inhibitor lactacystin (Lac, 10 μm) for the indicated time periods. B, The percentage radioactivity relative to the amount of radioactivity measured at time 0 for mutant subunits without lactacystin treatment in the absence (−) or presence (+) of lactacystin was plotted at each chase time (*p < 0.05, **p < 0.01 vs mutant without lactacystin; n = 4). C, Cells were mock transfected or transfected with γ2SFLAG (wt) or γ2SFLAG(Q351X) (mut) subunits and were incubated for 4 h in the absence or presence of 10 μm lactacystin before cell lysis. The immunopurified subunits were analyzed by immunoblot probed with an antibody against polyubiquitin (left) or FLAG (right) (n = 9). D, The total IDVs of polyubiquitin were measured from ∼37 to 200 kDa in both the wild-type and the mutant subunits. The normalized amounts of polyubiquitin IDVs from pooled data were plotted (n = 9; ***p < 0.001 vs wild type + lactacystin).
Figure 7.
Figure 7.
Mutant γ2S(Q351X) subunits were degraded through the lysosome pathway. A, Cells mock transfected (mock) or transfected with γ2S(Q351X)FLAG subunits were labeled with [35S]methionine for 20 min, followed by chase in the absence (−) or presence (+) of chloroquine (Chlo, 100 μm) for the indicated time periods. The cells were lysed, immunopurified using anti-Flag antibody, and analyzed by SDS-PAGE. B, The percentage radioactivity relative to the amount of radioactivity measured at time 0 for mutant subunits without chloroquine treatment in the absence (−) or presence (+) of chloroquine was plotted (*p < 0.05, **p < 0.01 vs mutant without chloroquine; n = 4). C, HEK 293T cells expressing equimolar concentrations of wild-type (wt) and mutant (mut) α1β2γ2SFLAG subunits were incubated without (−) or with (+) chloroquine (100 μm) for 4 h. The total lysates were immunopurified and immunoblotted with rabbit polyclonal anti-FLAG antibody. D, The total γ2 subunit protein IDVs with chloroquine treatment were normalized to the untreated group (*p < 0.05 vs wild type + chloroquine; n = 4).
Figure 8.
Figure 8.
Multiple truncated or misfolded GABAA receptor subunits formed SDS-resistant protein complexes, and cysteines 151 and 165 in the N terminus were involved in the formation of the SDS-resistant protein complexes. A, Schematic locations of mutations that were introduced to produce truncated γ2S subunits were indicated by red crosses. B, Total lysates of HEK 293T cells transfected with γ2S(Q351X)FLAG, γ2S(G234X)FLAG, γ2S(N258X)FLAG, γ2S(R284X)FLAG, and γ2S(V321X)FLAG subunits were immunopurified using anti-FLAG antibody and analyzed by SDS-PAGE. C, The ratios of the total IDVs of dimers over monomers for each truncated γ2S subunit in B were plotted. The data were normalized to wild-type γ2SFLAG subunit (wt). The ratio of the total IDVs of dimer in wild type was arbitrarily taken as 1 (n = 6) (C). D, Schematic topology of α1, β2, and γ2S subunits with deletions of a major portion of the intracellular TM3–TM4 loops were marked with red crosses to represent the portion of the intracellular TM3–TM4 loop that was removed. E, Total lysates of HEK 293T cells transfected with α1FLAG, β2FLAG, and γ2SFLAG with loop deletion, γ2SFLAG(wt) and γ2S(Q351X)FLAG subunits, and their partnering subunits were immunopurified using anti-FLAG antibody and analyzed by SDS-PAGE. The loop-deleted α1FLAG subunits were cotransfected with wild-type β2 and γ2S subunits; the loop-deleted β2FLAG subunits were cotransfected with α1 and γ2S subunits; and the wild-type, loop-deleted and mutant γ2S subunits were cotransfected with α1 and β2 subunits. F, The percentages of total IDVs of dimers over monomers for each condition were plotted [n = 4; ***p < 0.001 vs wild type; ††p < 0.01 vs γ2S(Q351X)FLAG; §§p < 0.01 vs β2FLAG loop deletion]. In B and E, the green arrows designated mutant γ2SFLAG subunits that migrated as monomers, and the red arrows designated potential subunit dimers. G, Schematic topology of γ2S(Q351X) subunits with cysteines C151 and C165 in the signature Cys-loop mutated to alanines. H, Total lysates of HEK 293T cells untransfected (U) or transfected with γ2S(Q351X)FLAG subunits without cysteines mutated (con) or with mutant γ2S(Q351X)FLAG subunits containing mutations in C151 (151), C165 (165), or both (151 + 165). Mutant γ2S(Q351X)FLAG subunits without or with mutation of the cysteines were immunopurified using anti-FLAG antibody and analyzed by SDS-PAGE. I, The total IDVs in H for γ2S(Q351X)FLAG subunits without or with mutation of the cysteines were plotted. The data were normalized to the γ2S(Q351X)FLAG subunit without mutant cysteines. The total IDV of γ2S(Q351X)FLAG subunits was arbitrarily taken as 1 [n = 4 from four different transfections; ***p < 0.001 vs γ2S(Q351X)FLAG subunit].

Similar articles

Cited by

References

    1. Baulac S, Huberfeld G, Gourfinkel-An I, Mitropoulou G, Beranger A, Prud'homme JF, Baulac M, Brice A, Bruzzone R, LeGuern E. First genetic evidence of GABAA receptor dysfunction in epilepsy: a mutation in the gamma2-subunit gene. Nat Genet. 2001;28:46–48. - PubMed
    1. Bennett MC, Bishop JF, Leng Y, Chock PB, Chase TN, Mouradian MM. Degradation of alpha-synuclein by proteasome. J Biol Chem. 1999;274:33855–33858. - PubMed
    1. Berke SJ, Paulson HL. Protein aggregation and the ubiquitin proteasome pathway: gaining the UPPer hand on neurodegeneration. Curr Opin Genet Dev. 2003;13:253–261. - PubMed
    1. Berkovic SF, Harkin L, McMahon JM, Pelekanos JT, Zuberi SM, Wirrell EC, Gill DS, Iona X, Mulley JC, Scheffer IE. De-novo mutations of the sodium channel gene SCN1A in alleged vaccine encephalopathy: a retrospective study. Lancet Neurol. 2006;5:488–492. - PubMed
    1. Cohen-Gadol AA, Bradley CC, Williamson A, Kim JH, Westerveld M, Duckrow RB, Spencer DD. Normal magnetic resonance imaging and medial temporal lobe epilepsy: the clinical syndrome of paradoxical temporal lobe epilepsy. J Neurosurg. 2005;102:902–909. - PubMed

Publication types

LinkOut - more resources