. 2010 Dec;21(23):4227-39.
doi: 10.1091/mbc.E10-05-0449. Epub 2010 Oct 13.

Arsenic-induced SUMO-dependent recruitment of RNF4 into PML nuclear bodies

Affiliations

Arsenic-induced SUMO-dependent recruitment of RNF4 into PML nuclear bodies

Marie-Claude Geoffroy et al. Mol Biol Cell. 2010 Dec.

Abstract

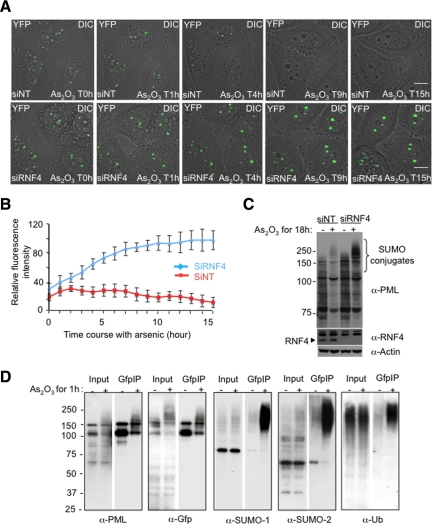
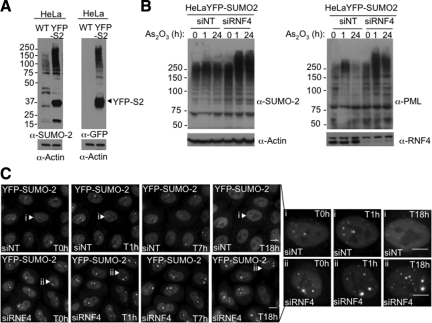
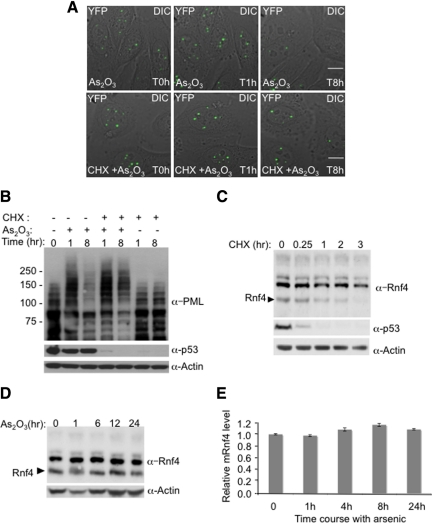
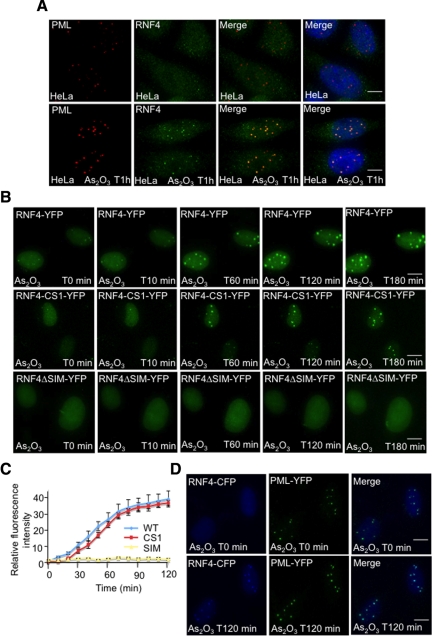
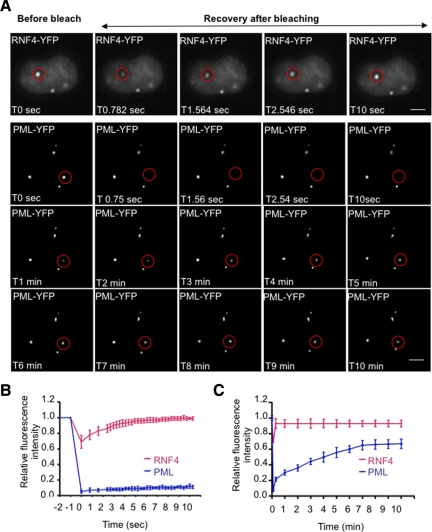
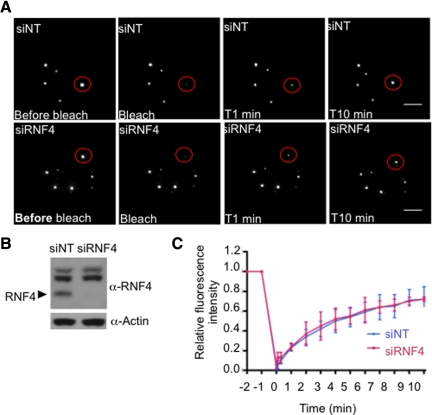
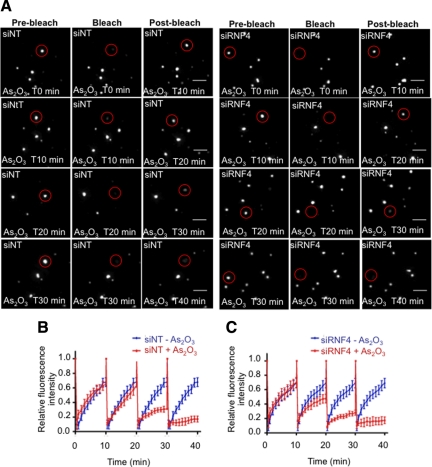
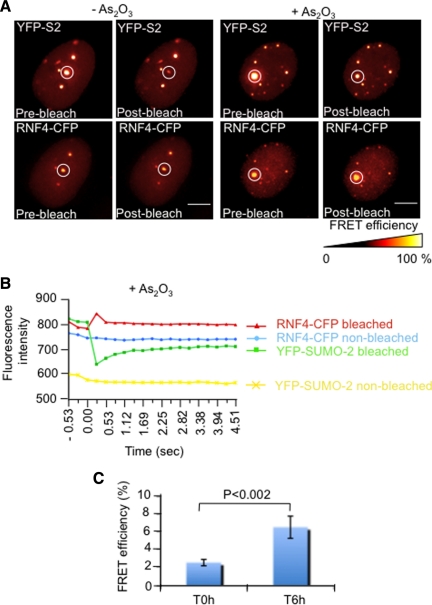
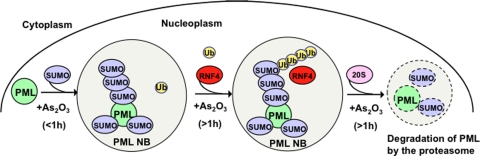
In acute promyelocytic leukemia (APL), the promyelocytic leukemia (PML) protein is fused to the retinoic acid receptor alpha (RAR). Arsenic is an effective treatment for this disease as it induces SUMO-dependent ubiquitin-mediated proteasomal degradation of the PML-RAR fusion protein. Here we analyze the nuclear trafficking dynamics of PML and its SUMO-dependent ubiquitin E3 ligase, RNF4 in response to arsenic. After administration of arsenic, PML immediately transits into nuclear bodies where it undergoes SUMO modification. This initial recruitment of PML into nuclear bodies is not dependent on RNF4, but RNF4 quickly follows PML into the nuclear bodies where it is responsible for ubiquitylation of SUMO-modified PML and its degradation by the proteasome. While arsenic restricts the mobility of PML, FRAP analysis indicates that RNF4 continues to rapidly shuttle into PML nuclear bodies in a SUMO-dependent manner. Under these conditions FRET studies indicate that RNF4 interacts with SUMO in PML bodies but not directly with PML. These studies indicate that arsenic induces the rapid reorganization of the cell nucleus by SUMO modification of nuclear body-associated PML and uptake of the ubiquitin E3 ligase RNF4 leading to the ubiquitin-mediated degradation of PML.


Figures

Figure 1.
Figure 1.
Establishment and characterization of HeLa PML-YFP stable cell line. (A) Schematic showing the nuclear isoforms of PML that share the same N-terminal region but differ in their C termini due to the alternative splicing of exons 7–9. Nuclear PML isoforms I to V harbor three SUMOylation sites (K65, K160, and K490), a SUMO-interacting motif (SIM), a nuclear localization signal (nls), and a RBCC motif containing a RING finger domain (R) adjacent to two zinc coordinating B-boxes and a coiled-coil domain (CC). PML VI differs from the other PML isoforms due the absence of a SIM domain. (B) Whole cell extracts from parental HeLa cells and HeLa PML-YFP were analyzed by SDS-PAGE followed by Western Blot using a rabbit anti-PML antibody. An anti-actin antibody was used as a control of loading. (C) HeLa were stably transfected with a plasmid expressing PML-YFP placed under the control of EF1 promoter. Endogenous PML in parental HeLa cells (wt) was detected with a chicken antibody to PML and PML in cells stably expressing the PML-YFP fusion protein was detected by immunofluorescence using a mouse anti-PML antibody whereas expression of the fluorescent-tagged PML protein was visualized by YFP fluoresence. DNA was stained with DAPI. Bar, 5 μm. (D). Graph showing the number of PML bodies in HeLa wt and HeLa PML-YFP. (E) Cell cycle analysis of HeLa and HeLa PML-YFP cell lines was determined by flow cytometry. The percentage of cells in G1, S and G2/M phase was determined by measuring the intensity of DNA staining with propidium iodide (FL2-H).
Figure 2.
Figure 2.
Effect of RNF4 on arsenic-induced PML degradation in real time. (A) Time lapse experiments were performed on HeLa PML-YFP stable cells transfected with a nontarget siRNA (siNT) or a siRNA against RNF4 (siRNF4) and exposed to 1 μM arsenic for 18h. PML-YFP was imaged in real time by fluoresence microscopy over 15 h by collecting a stack of 20 sections with the YFP channel (green) and one image with the differential interference contrast (DIC) every 15 min. The projected z-sections collected in YFP channel were merged to the respective DIC image to monitor the position of PML NB within the cells. Bar, 5 μM. (B) Fluorescence intensity of PML bodies was quantified by defining a region of interest containing one PML body and comparing it a region in the nucleoplasm. Relative fluorescence intensity represents the difference of intensities between these two regions. The graph shows mean values from at least 10 cells. (C) Whole cell extracts from PML-YFP HeLa cells transfected with siRNA to RNF4 or a nontarget siRNA were analyzed by SDS PAGE followed by Western Blotting with a chicken anti-PML antibody to show the accumulation of PML in the absence of RNF4. Depletion of RNF4 was controlled with a rabbit anti-RNF4 antibody. (D) Nuclear extracts from PML-YFP HeLa cells either untreated or exposed to 1 uM arsenic for 1 h were incubated with GFP-trap beads and bound proteins collected. Proteins were eluted from the beads and analyzed by SDS-PAGE followed by Western blotting with antibodies against PML, GFP, SUMO-1, SUMO-2, and ubiquitin to evaluate proteins bound to PML-YFP. The input represents 10% of the nuclear lysate.
Figure 3.
Figure 3.
Subcellular localization of SUMO-2 during arsenic treatment. (A) Characterization of HeLa YFP-SUMO-2 cell line. HeLa cells were stably transfected with a plasmid expressing a YFP-SUMO-2 fusion protein. Whole cells extracts from both parental HeLa and stable YFP-SUMO-2 cells were analyzed by SDS-PAGE followed by Western blot with rabbit anti-SUMO-2 and mouse anti-GFP antibodies. (B) HeLa YFP-SUMO-2 stable cell line was transfected with siRNA to RNF4 or a control nontargeting si RNA (NT) for 48 h before adding 1 μM of arsenic. Whole cell extracts were analyzed by SDS-PAGE followed by Western Blotting with rabbit anti-SUMO-2 and chicken anti-PML antibodies. Depletion of RNF4 was controlled with a rabbit anti-RNF4 antibody. (C) Subcellular localization of SUMO-2 during arsenic treatment. YFP-SUMO-2 HeLa cells were transfected with siRNA to RNF4 or a control nontargeting siRNA (NT) and YFP fluorescence measured for 18 h after the addition of 1 μM of arsenic. Images shows a projection of z-sections collected into YFP channel at selected time points. Bar, 5 μM.
Figure 4.
Figure 4.
Inhibition of RNF4 synthesis blocks arsenic-induced PML degradation. (A and B) Arsenic fails to induce the degradation of PML when protein translation is inhibited. HeLa PML-YFP stable cells were incubated with 1 μM arsenic and 50 μg/ml cycloheximide and analyzed by fluorescence microscopy for 16h (A). A stack of 20 z-sections was collected every 15 min in the YFP channel (green), and one image was taken with differential interference contrast (DIC). The projected z-stacks were merged to the respective DIC image. Bar, 5 μM. The level of PML and p53 proteins were analyzed during arsenic and cycloheximide treatment by SDS PAGE followed by Western Blotting with chicken PML and mouse p53 antibodies (B). (C) Monitoring of RNF4 and p53 protein levels during cycloheximide treatment. PML-YFP HeLa cells were incubated with 50 μg/ml cycloheximide, and whole cell extracts were analyzed at different times by SDS PAGE followed by Western Blotting with rabbit RNF4 and mouse p53 antibodies. (D) Arsenic does not alter the level of RNF4 protein. Total cells extracts from HeLa PML-YFP exposed to arsenic for 24 h were analyzed by SDS PAGE followed by Western blot with a rabbit anti-RNF4 antibody to follow the level of RNF4 during arsenic treatement. (E) Quantification of Rnf4 transcripts during arsenic treatment. Total RNA from HeLa PML-YFP stable cells exposed to 1 μM arsenic for 24 h was extracted and real-time quantitative PCR was performed with specific gene primers for RNF4 and actin. The graph shows the relative mRNF4 level after normalization to actin transcripts.
Figure 5.
Figure 5.
Arsenic-induced SUMO-dependent recruitment of RNF4 into PML nuclear bodies. (A and B) Subcellular localization of RNF4 during arsenic treatment. (A) HeLa cells were exposed to 1 uM arsenic for 60 min and the localization of endogenous PML and RNF4 determined by immunofluorescence using 5E10 mAb to PML and an affinity purified chicken antibody to RNF4. (B) HeLa cells were transfected with fluorescent-tagged RNF4 plasmids expressing either wild type RNF4-YFP or protein mutated in the RING domain of RNF4 (RNF4-YFP-CS1) or RNF4 with all 4 SIMs mutated (RNF4-delta SIM). YFP fluorescence (green) was monitored in real-time microscopy after arsenic treatment by collecting a stack of 20 z-sections every 10 min for 3 h. Images represent a projection of the z-sections. (C) Quantification of RNF4-YFP fluorescence was determined by measuring the difference of fluorescence intensity between one PML body and a region outside the nucleoplasm. The graph shows means values of the relative fluorescence intensity after normalization from 10 cells. (D) Arsenic-induced recruitment of RNF4 in HeLa PML-YFP stable cells. PML-YFP HeLa cells were transfected with a RNF4-CFP plasmid and fluorescence monitored for 2 h after addition of arsenic. Images shows the recruitment of RNF4-CFP (blue) within PML bodies (green). Bar, 5 μM.
Figure 6.
Figure 6.
Comparison of RNF 4 and PML mobility. (A) The mobility of RNF4 and PML III was analyzed by Fluorescence Recovery After Photobleaching (FRAP) on living HeLa PML-YFP stable cells or HeLa cells transfected with RNF4-YFP. Circled areas (red) containing one PML NB were bleached to background level and the fluorescence recovery of RNF4 and PML was monitored for 11 s and 10 min, respectively. A single image was taken for RNF4 at selected time point, whereas a stack of 20 sections was collected every minute for PML. Images for PML represent a projection of z-sections. Bar, 5 μm. (B and C) Quantification of FRAP experiments. The fluorescence intensity in the bleached area was normalized to the change in fluorescence intensity outside the nucleus and in an unbleached PML NB. The graphs (B and C) show the mean values and standard deviations of relative prebleach and postbleach intensities of ten PML Nbs which was plotted over time in sec (B) or in min (C).
Figure 7.
Figure 7.
RNF4 does not affect PML trafficking between PML and nucleoplasm. (A–C) Effect of RNF4 on PML mobility. (A) FRAP experiments were performed on HeLa PML-YFP stable cells transfected with a nontarget siRNA (siNT) or an siRNA against RNF4 (siRNF4). Images represent projection of z-sections of PML NBs before and after photobleaching over a period of 10 min. Bar, 5 μM. (B) Depletion of RNF4 was controled by SDS PAGE followed by Western blot with rabbit RNF4 antibody. (C) The graph shows the mean values and standard deviations of relative prebleach and postbleach intensities of ten PML Nbs as described in Figure 6.
Figure 8.
Figure 8.
Effect of RNF4 on PML mobility during arsenic treatment. (A–C) RNF4 does not affect PML mobility during arsenic treatment. (A) PML fluorescence recovery after photobleaching was determined after arsenic treatment in HeLa PML-YFP stable cells transfected with a nontarget siRNA (siNT) or a siRNA against RNF4 (siRNF4). PML NBs were bleached after a period of 10, 20, 30, or 40 min of incubation with arsenic and fluorescence recovery was monitored over a period of 10 min for each time point. Images represent projection of z-sections of PML NBs before and after photobleaching over a period of 10 min. Bar, 5 μM. (B and C) The graphs show the mean values and standard deviations of relative prebleach and postbleach intensities of PML NBs from five different experiments.
Figure 9.
Figure 9.
In vivo interaction of RNF4-CFP with YFP-SUMO-2. (A) Fluorescence Resonance Energy Transfer (FRET) acceptor photobleaching was done on HeLa cells cotransfected with plasmids expressing RNF4-CFP and YFP-SUMO-2 either untreated or treated with 1 μΜ arsenic. Images shows sequential CFP and YFP fluorescence collected before and after photobleaching of a circled area (red) containing one PML NB. Bar 5 μM. (B) The graph shows the CFP and YFP fluorescence intensities of bleached and nonbleached nuclear areas of similar-sizes from cells exposed to arsenic for 6 h. (C) FRET efficiencies during arsenic treatment. The graph shows the mean values and SD of the FRET efficiency from five independent experiments. FRET efficiency is represented as the percent of increase of prebleach CFP fluorescence after YFP photobleaching of one PML NB.
Figure 10.
Figure 10.
Model for the subnuclear trafficking of PML and RNF4 in response to arsenic. Details of the model are described in the text.

References

    1. Bailey D., O'Hare P. Comparison of the SUMO1 and ubiquitin conjugation pathways during the inhibition of proteasome activity with evidence of SUMO1 recycling. Biochem. J. 2005;392:271–281. - PMC - PubMed
    1. Bernardi R., Pandolfi P. P. Structure, dynamics and functions of promyelocytic leukaemia nuclear bodies. Nat. Rev. Mol. Cell Biol. 2007;8:1006–1016. - PubMed
    1. de The H., Chomienne C., Lanotte M., Degos L., Dejean A. The t(15;17) translocation of acute promyelocytic leukaemia fuses the retinoic acid receptor alpha gene to a novel transcribed locus. Nature. 1990;347:558–561. - PubMed
    1. de The H., Lavau C., Marchio A., Chomienne C., Degos L., Dejean A. The PML-RAR alpha fusion mRNA generated by the t(15;17) translocation in acute promyelocytic leukemia encodes a functionally altered RAR. Cell. 1991;66:675–684. - PubMed
    1. Dyck J.A., Maul G. G., Miller W. H., Chen J. D., Kakizuka A., Evans R. M. A novel macromolecular structure is a target of the promyelocyte-retinoic acid receptor oncoprotein. Cell. 1994;76:333–343. - PubMed

Publication types

MeSH terms

Substances