. 2011 Jan;187(1):9-19.
doi: 10.1534/genetics.110.123117. Epub 2010 Oct 13.

Overlapping regulation of CenH3 localization and histone H3 turnover by CAF-1 and HIR proteins in Saccharomyces cerevisiae

Affiliations

Overlapping regulation of CenH3 localization and histone H3 turnover by CAF-1 and HIR proteins in Saccharomyces cerevisiae

Jessica Lopes da Rosa et al. Genetics. 2011 Jan.

Abstract

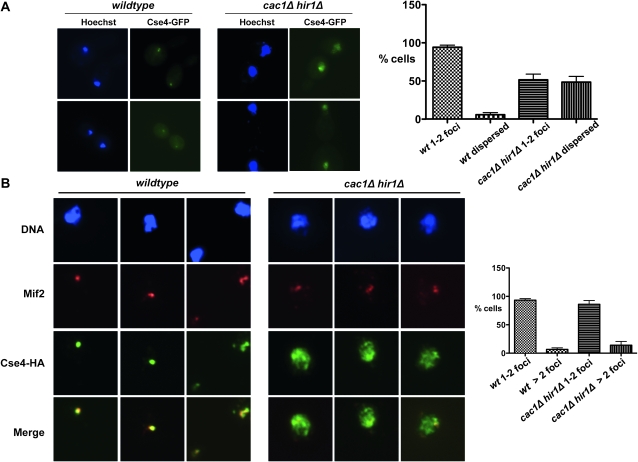
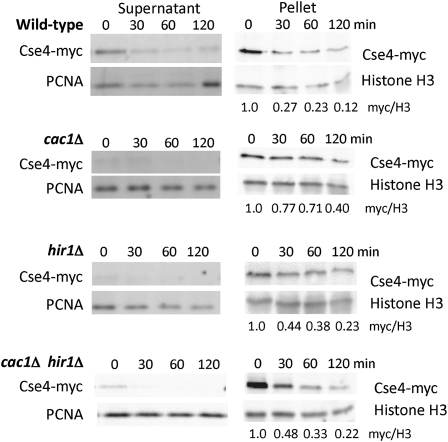
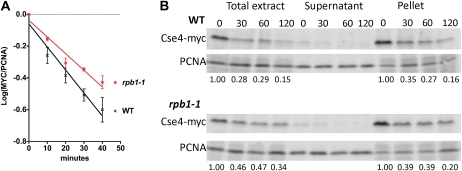
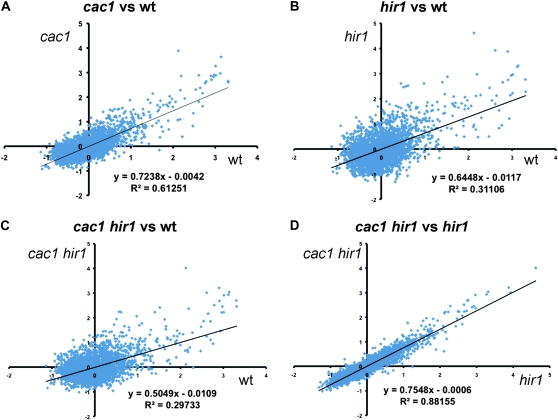
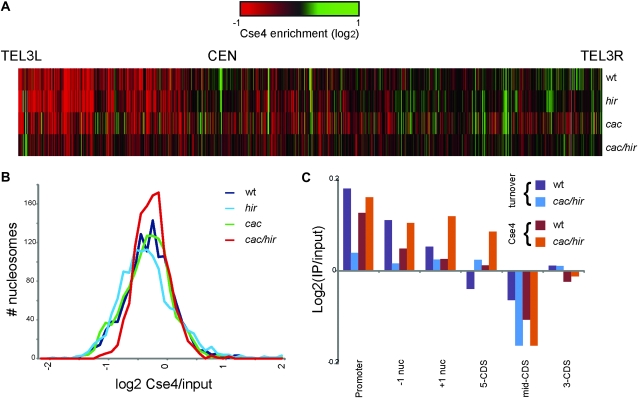
Accurate chromosome segregation is dependent on the centromere-specific histone H3 isoform known generally as CenH3, or as Cse4 in budding yeast. Cytological experiments have shown that Cse4 appears at extracentromeric loci in yeast cells deficient for both the CAF-1 and HIR histone H3/H4 deposition complexes, consistent with increased nondisjunction in these double mutant cells. Here, we examined molecular aspects of this Cse4 mislocalization. Genome-scale chromatin immunoprecipitation analyses demonstrated broader distribution of Cse4 outside of centromeres in cac1Δ hir1Δ double mutant cells that lack both CAF-1 and HIR complexes than in either single mutant. However, cytological localization showed that the essential inner kinetochore component Mif2 (CENP-C) was not recruited to extracentromeric Cse4 in cac1Δ hir1Δ double mutant cells. We also observed that rpb1-1 mutants displayed a modestly increased Cse4 half-life at nonpermissive temperatures, suggesting that turnover of Cse4 is partially dependent on Pol II transcription. We used genome-scale assays to demonstrate that the CAF-1 and HIR complexes independently stimulate replication-independent histone H3 turnover rates. We discuss ways in which altered histone exchange kinetics may affect eviction of Cse4 from noncentromeric loci.


Figures

F<sc>igure</sc> 1.—
Figure 1.—
Extracentromeric Cse4 in the absence of CAF-1 and HIR complexes. (A) Live cell imaging of wild-type (PKY3054) and cac1Δ hir1Δ (PKY3057) cells that produce Cse4–GFP. Cells were treated with Hoechst to stain the DNA. Percentages of cells with either dispersed Cse4–GFP localization or 1–2 small foci are indicated on the right, with mean and SEM bars shown for two experiments, each with n > 100 cells. 1–2 foci: wild-type 94.25 ± 2.75%, cac1Δ hir1Δ 51.5 ± 7.5%; dispersed: wild-type 5.75 ± 2.75%, cac1Δ hir1Δ 48.5 ± 7.5%. Unpaired, two-tailed t-tests showed that the wild-type and cac1Δ hir1Δ samples were significantly different (P < 0.035 for both 1–2 foci and dispersed classes). (B) Kinetochore protein Mif2 is not recruited to extracentromeric Cse4 in cac1Δ hir1Δ cells. Chromosome spreads were prepared from wild-type (PKY2443) and cac1Δ hir1Δ (PKY2453) cells expressing Cse4–HA under the control of its endogenous promoter. Mouse anti-Mif2 and rabbit anti-HA were used to detect endogenous Mif2 and Cse4–HA. DNA is stained with DAPI. Percentages of cells with 1–2 or > 2 Mif2 foci is indicated on the right, with average and SEM bars shown for three experiments, each with n > 100 cells. 1–2 foci: wild-type 93.33 ± 2.73%, cac1Δ hir1Δ 86 ± 6.66%; >2 foci: wild-type 6.67 ± 2.73%, cac1Δ hir1Δ 14 ± 6.66%. Mann–Whitney nonparametric, two-tailed t-tests showed that the wild-type and cac1Δ hir1Δ samples were not significantly different (P > 0.5 for both 1–2 foci and > 2 foci classes).
F<sc>igure</sc> 2.—
Figure 2.—
Protein stability and chromosome association of Cse4. The stability of Cse4–myc was monitored in wild-type (PKY3412), cac1Δ (PKY3413), hir1Δ (PKY3414), and cac1Δ hir1Δ (PKY3415) strains. Strains were grown in raffinose, and CSE4myc12 expression was induced by galactose for 3 hr. At time 0, cells were shifted to media containing dextrose and cycloheximide to shutoff CSE4myc12 expression. At the indicated time points (in minutes), cells were harvested, and nuclei were prepared, separated into soluble and chromosome-bound pellet fractions, and analyzed by immunoblotting. PCNA serves as the loading control for the soluble extracts, and histone H3 is the loading control for the chromosome-bound pellet material. For the pellets, the ratios of background-subtracted Cse4–myc and PCNA signals were calculated and normalized to 1.0 at time 0; values at each time point are shown beneath each lane.
F<sc>igure</sc> 3.—
Figure 3.—
Chromosome spreads were performed on wild-type (PKY3412) and cac1Δ hir1Δ (PKY3415) cells that express CSE4myc12 driven by the GAL1 promoter. Cells were grown in galactose-containing media and switched to glucose-containing media. Samples were taken at 0, 1, and 2 hr after repression with glucose. Immunofluorescence was performed with a rabbit anti-Mif2 antibody to visualize centromeres and a mouse anti-myc antibody to detect Cse4–myc. DNA was stained with DAPI. To image Cse4–myc in cac1Δ hir1Δ cells, the camera exposure time was half as long as that for Cse4–myc images for other cell types.
F<sc>igure</sc> 4.—
Figure 4.—
Thermal inactivation of RNA polymerase II mildly increases Cse4 stability. The stability of Cse4–myc was monitored in wild-type (PKY3412) and rpb1-1ts (PKY4233) cells as described for Figure 2A, except that cells were grown at the permissive temperature (23°) during galactose treatment and then transferred to prewarmed YP + 2% dextrose + 400 μm cycloheximide at the restrictive temperature (37°) to shut off Cse4–myc synthesis. (A) Loss of Cse4–myc in total extracts was quantitatively analyzed in two experiments and shown to differ significantly (P-value = 0.028). Cells were grown in galactose for 2 hr and samples were collected at 0, 10, 20, 30, and 40 min after shutoff. Ratios of Cse4–myc to PCNA were quantified and normalized as in Figure 2. The log10 ratios and standard error of the mean (SEM) were graphed using GraphPad Prism software. (B) Cells were grown at the permissive temperature (23°) during galactose treatment for 3 hr prior to transfer to YPD + cycloheximide at 37°. Samples were collected at 0, 30, 60, and 120 min after shutoff, and whole cell and fractionated extracts were analyzed by immunoblotting. For the whole cell and pellet fractions, the ratios of background-subtracted Cse4–myc and PCNA signals were calculated using MultiGauge software and normalized to 1.0 at time 0; values at each time point are shown beneath each lane.
F<sc>igure</sc> 5.—
Figure 5.—
Altered rates of histone turnover in chromatin assembly mutants. Yeast strains (PKY4323-6) all carried a FLAG-tagged histone H3 gene driven by the inducible GAL1 promoter. Epitope tag incorporation into nucleosomes was measured 90 min after induction of FLAG–H3 expression in duplicate experiments via chromatin IP/microarray analysis. Normalized rates for two strains are graphed relative to each other. Linear regression fits to the data are shown. (A) cac1 vs. wt. (B) hir1 vs. wt. (C) cac1 hir1 vs. wt. (D) cac1 hir1 vs. hir1.
F<sc>igure</sc> 6.—
Figure 6.—
Genome-scale localization of Cse4–HA in wt (PKY2299), cac1Δ (PKY2295), hir1Δ (PKY2297), and cac1Δ hir1Δ (PKY2300) cells detected via chromatin IP/microarray analysis. (A) Heat map of Cse4 enrichment along yeast chromosome III. (B) Distribution of Cse4 signal per nucleosome in each strain. cac1Δ hir1Δ cells display a narrower distribution than the other three strains. (C) Correlation of Cse4 localization with rates of H3 turnover (Figure 5) at various types of genomic locus.

References

    1. Anderson, M., J. Haase, E. Yeh and K. Bloom, 2009. Function and assembly of DNA looping, clustering, and microtubule attachment complexes within a eukaryotic kinetochore. Mol. Biol. Cell 20 4131–4139. - PMC - PubMed
    1. Au, W. C., M. J. Crisp, S. Z. DeLuca, O. J. Rando and M. A. Basrai, 2008. Altered dosage and mislocalization of histone H3 and Cse4p lead to chromosome loss in Saccharomyces cerevisiae. Genetics 179 263–275. - PMC - PubMed
    1. Bloom, K., 2007. Centromere dynamics. Curr. Opin. Genet. Dev. 17 151–156. - PubMed
    1. Bloom, K. S., and J. Carbon, 1982. Yeast centromere DNA is in a unique and highly ordered structure in chromosomes and small circular minichromosomes. Cell 29 305–317. - PubMed
    1. Bram, R. J., and R. D. Kornberg, 1987. Isolation of a Saccharomyces cerevisiae centromere DNA-binding proteins, its human homolog, and its possible role as a transcription factor. Mol. Cell. Biol. 7 403–409. - PMC - PubMed

Publication types

MeSH terms