. 2011 Jan;187(1):299-317.
doi: 10.1534/genetics.110.120766. Epub 2010 Oct 13.

System-level analysis of genes and functions affecting survival during nutrient starvation in Saccharomyces cerevisiae

Affiliations

System-level analysis of genes and functions affecting survival during nutrient starvation in Saccharomyces cerevisiae

David Gresham et al. Genetics. 2011 Jan.

Abstract

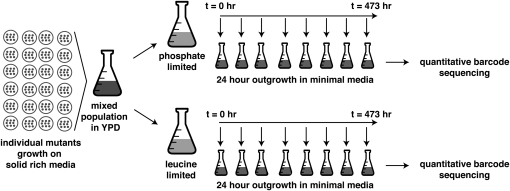
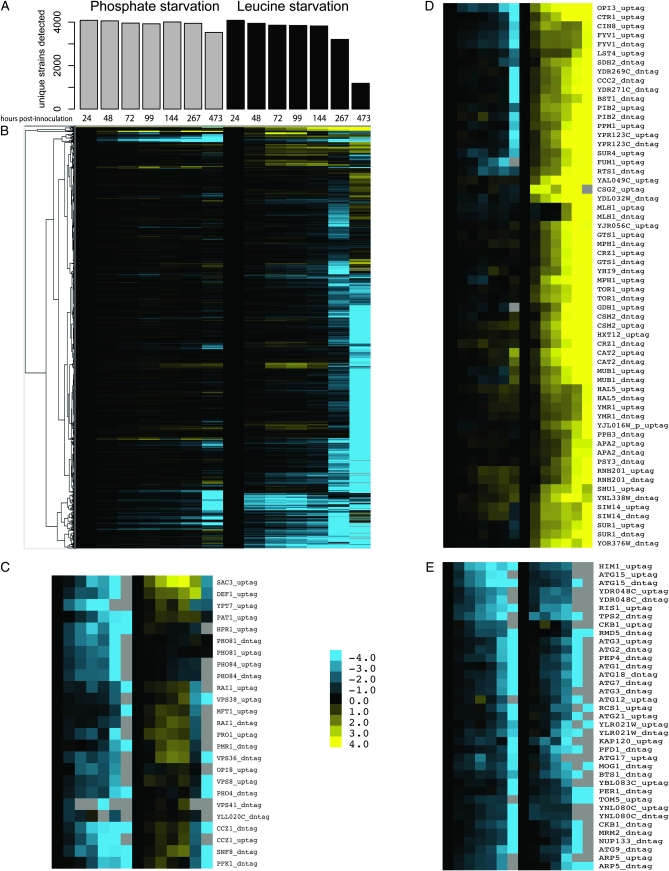
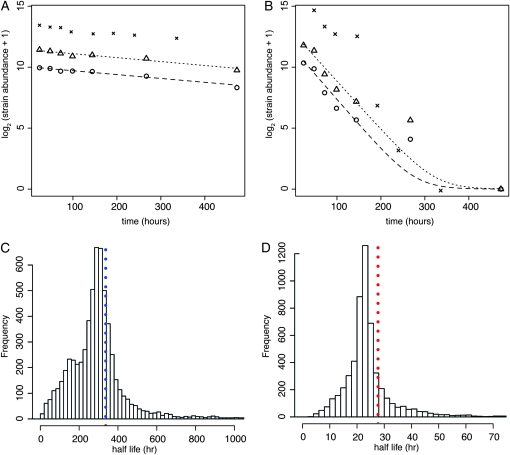
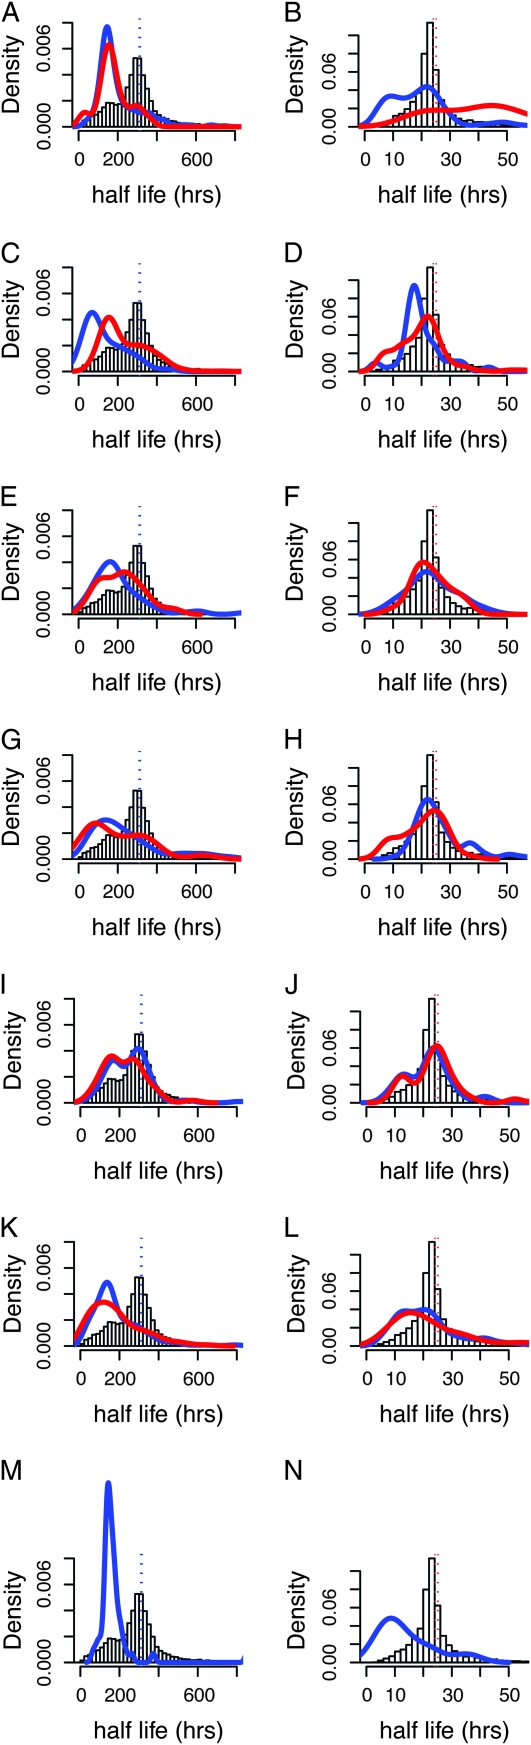
An essential property of all cells is the ability to exit from active cell division and persist in a quiescent state. For single-celled microbes this primarily occurs in response to nutrient deprivation. We studied the genetic requirements for survival of Saccharomyces cerevisiae when starved for either of two nutrients: phosphate or leucine. We measured the survival of nearly all nonessential haploid null yeast mutants in mixed populations using a quantitative sequencing method that estimates the abundance of each mutant on the basis of frequency of unique molecular barcodes. Starvation for phosphate results in a population half-life of 337 hr whereas starvation for leucine results in a half-life of 27.7 hr. To measure survival of individual mutants in each population we developed a statistical framework that accounts for the multiple sources of experimental variation. From the identities of the genes in which mutations strongly affect survival, we identify genetic evidence for several cellular processes affecting survival during nutrient starvation, including autophagy, chromatin remodeling, mRNA processing, and cytoskeleton function. In addition, we found evidence that mitochondrial and peroxisome function is required for survival. Our experimental and analytical methods represent an efficient and quantitative approach to characterizing genetic functions and networks with unprecedented resolution and identified genotype-by-environment interactions that have important implications for interpretation of studies of aging and quiescence in yeast.


Figures

F<sc>igure</sc> 1.—
Figure 1.—
Survival and physiological parameters for heterogeneous mutant populations during starvation conditions. The entire collection of haploid deletion mutants was starved for either phosphate (+) or leucine (x) in the presence (solid line) or absence (dashed line) of kanamycin for nearly 500 hr following an initial period of 24 hr of batch growth. (A) Survival of replicate populations grown in media of identical composition except for the limiting nutrient. Survival of each population was monitored by determining viability of the population at each time point by counting CFUs on rich media plates. (B) The total number of cells per milliliter was determined at each time point and remained essentially unchanged throughout the starvation regime. (C) Culture biomass was estimated using a Klett colorimeter and showed a gradual increase for populations starved for phosphate and gradual decrease when populations were starved for leucine. (D) The average cell volume, measured using a Coulter counter, showed a gradual increase for populations starved for phosphate and a slow decline for populations starved for leucine.
F<sc>igure</sc> 2.—
Figure 2.—
Development and validation of quantitative barcode sequencing for multiplexed mutant screens. We tested the error and variance associated with each step of our protocol. (A) By sequencing a single barcode we found that 98% of sequences up to sequencing cycle 23 (dashed line) perfectly match the expected sequence (n = 2,340,984). (B) Additional cycles of PCR introduce minimal variation in the estimated proportions of mutants. The best-correlated estimates of mutant abundance are found between 15 and 25 PCR cycles (increasingly darker shaded values approach a correlation of 1.0; the minimum correlation is 0.94). (C) Resequencing the same PCR product from a complex mixture of mutants on two different flow cells yields highly reproducible results (Pearson's correlation = 0.99; n = 3329). (D) Complete technical replicates of quantitative barcode sequencing (i.e., independent DNA preparations, PCR, and sequencing reactions) are highly reproducible (Pearson's correlation = 0.94; n = 3439).
F<sc>igure</sc> 3.—
Figure 3.—
Experimental design for multiplexed mutant survival analysis using quantitative barcode sequencing. We constructed normalized pools of the yeast haploid deletion collection by growing individual mutants on rich media (YDP) plates and pooling mutants in liquid YPD for archival purposes. A 1.6-ml aliquot of the unselected pooled mutants was used to inoculate (t = 0) cultures limited for either phosphate or leucine. The starvation period commenced after 24 hr of culture growth. At each time point we removed a 1-ml sample from the culture and expanded the viable subpopulation by allowing 24 hr of outgrowth in supplemented minimal media. DNA was isolated from the resulting culture and analyzed using quantitative barcode sequencing.
F<sc>igure</sc> 4.—
Figure 4.—
Population diversity decline and mutant abundance profiles during prolonged starvation. (A) We determined the number of unique strains identified through barcode sequencing at each time point for populations starved for phosphate (gray bars) or leucine (black bars). (B) Hierarchical clustering of mutant abundance profiles during starvation experiments. We clustered vectors of relative abundance in the population normalized by the abundance of each mutant at t = 24 hr (log2 transformed). Black indicates that the strain has not changed in abundance. Yellow represents increases in abundance and blue represents decreases in abundance. Failure to detect the strain in the population is indicated by gray. We identified clusters of mutants that were specifically either (C) decreased in relative abundance upon phosphate starvation or (D) increased in relative abundance upon leucine starvation. Several mutants are decreased in relative abundance under both starvation conditions including (E) a cluster including several autophagy gene mutants.
F<sc>igure</sc> 5.—
Figure 5.—
Quantitative analysis of absolute death rates during prolonged starvation. We calculated the absolute rate of death for mutants using measurements of population viability and estimates of relative strain abundance using quantitative barcode sequencing of uptags (circles) and downtags (triangles) for the putatively neutral HOΔ0 allele starved for phosphate (A) and leucine (B). The data presented are barcode counts normalized between all uptag or downtag sequencing results. A value of 1 was added to all normalized barcode counts prior to log2 transformation. The rate of death was determined using a generalized linear model for uptag (long-dashed line) and downtag (short-dashed line) data. These rates were compared to rates calculated from independent data (viable cells per microliter) obtained for the isogenic strain BY4742 (x's) subjected to starvation in pure cultures. We calculated death rates for all mutants in each starvation condition and converted these values to half-lives for all barcode data that yielded a significant death rate (FDR <5%). The distribution of half-lives for mutants starved for phosphate is centered around 289 hr (C) and 22.8 hr (D) for leucine-starved mutants. The half-life of the HOΔ0 strain when starved for phosphate (blue dotted line) or leucine (red dotted line) is shown for reference.
F<sc>igure</sc> 6.—
Figure 6.—
Functional gene modules altering survival during nutrient starvation. The distributions of half-lives for subsets of genes defined by different methods of categorization were compared with the overall distribution of half-lives (white bars) in each experiment shown. (A) Phosphate starvation, mitochondrion organization (blue, Go Slim term, n = 281, P = 5.88 × 10−41) and peroxisome organization (red, GO:0007031, n = 27, P = 0.00013). (B) Leucine starvation, mitochondrion organization (blue, Go Slim term, n = 276, P = 9.23 × 10⁻¹⁴) and peroxisome organization (red, GO:0007031, n = 25, P = 4.63 × 10⁻⁵). (C) Phosphate starvation, autophagy (blue, GO:0006914, n = 51, P = 2.0 × 10⁻¹³) and translation (red, GO:0006412, n = 305, P = 1.46 × 10⁻¹²). (D) Leucine starvation, autophagy (blue, GO:0006914, n = 50, P = 0.00014) and translation (red, GO:0006412, n = 301, P = 2.33 × 10⁻¹¹). (E) Phosphate starvation, mRNA processing (blue, GO:0006397, n = 91, P = 3.38 × 10⁻¹¹) and mRNA transport (red, GO:0051028, n = 42, P = 6.45 × 10⁻⁵). (F) Leucine starvation, mRNA processing (blue, GO:0006397, n = 91, P = 0.87) and mRNA transport (red, GO:0051028, n = 40, P = 0.87). (G) Phosphate starvation, chromatin modification (blue, GO:0016568, n = 89, P = 2.86 × 10⁻⁶) and histone acetyltransferase complex (red, SGD-defined protein complex, n = 41, P = 8.82 × 10⁻⁵). (H) Leucine starvation, chromatin modification (blue, GO:0016568, n = 90, P = 0.032) and histone acetyltransferase complex (red, SGD-defined protein complex, n = 40, P = 0.16). (I) Phosphate starvation, cytoskeleton (blue, GO:0005856, n = 151, P = 2.03 × 10⁻⁵) and microtubule organizing center (red, SGD-defined protein complex, n = 30, P = 3.16 × 10⁻⁵). (J) Leucine starvation, cytoskeleton (blue, GO:0005856, n = 148, P = 0.14) and microtubule organizing center (red, SGD-defined protein complex, n = 30, P = 0.75). (K) Phosphate starvation, slow growth in YPD (blue, defined by Giaever et al. 2002, n = 637, P =2.46 × 10−103) and impaired growth in rapamycin (red, defined by Dudley et al. 2005, n = 137, P = 1.16 × 10⁻¹⁹). (L) Leucine starvation, slow growth in YPD (blue, defined by Giaever et al. 2002, n = 619, P = 3.04 × 10⁻¹⁶) and impaired growth in rapamycin (red, defined by Dudley et al. 2005, n = 132, P = 0.00058). (M) Phosphate starvation, MRPL10 cluster of the yeast metabolic cycle (blue, defined in Tu et al. 2005, n = 54, P = 1.62 × 10⁻¹⁶). (N) Leucine starvation, MRPL10 cluster of the yeast metabolic cycle (blue, defined in Tu et al. 2005, n = 53, P = 4.8 × 10⁻⁶).

References

    1. Bauer, F., M. Urdaci, M. Aigle and M. Crouzet, 1993. Alteration of a yeast SH3 protein leads to conditional viability with defects in cytoskeletal and budding patterns. Mol. Cell. Biol. 13 5070–5084. - PMC - PubMed
    1. Boer, V. M., S. Amini and D. Botstein, 2008. Influence of genotype and nutrition on survival and metabolism of starving yeast. Proc. Natl. Acad. Sci. USA 105 6930–6935. - PMC - PubMed
    1. Boer, V. M., C. A. Crutchfield, P. H. Bradley, D. Botstein and J. D. Rabinowitz, 2010. Growth-limiting intracellular metabolites in yeast growing under diverse nutrient limitations. Mol. Biol. Cell 21 198–211. - PMC - PubMed
    1. Boyle, E. I., S. Weng, J. Gollub, H. Jin, D. Botstein et al., 2004. GO:TermFinder—open source software for accessing Gene Ontology information and finding significantly enriched Gene Ontology terms associated with a list of genes. Bioinformatics 20 3710–3715. - PMC - PubMed
    1. Brauer, M. J., A. J. Saldanha, K. Dolinski and D. Botstein, 2005. Homeostatic adjustment and metabolic remodeling in glucose-limited yeast cultures. Mol. Biol. Cell 16 2503–2517. - PMC - PubMed

Publication types

MeSH terms