. 2010 Dec;20(12):1651-62.
doi: 10.1101/gr.108787.110. Epub 2010 Oct 13.

Assessing the effect of the CLPG mutation on the microRNA catalog of skeletal muscle using high-throughput sequencing

Affiliations

Assessing the effect of the CLPG mutation on the microRNA catalog of skeletal muscle using high-throughput sequencing

Florian Caiment et al. Genome Res. 2010 Dec.

Abstract

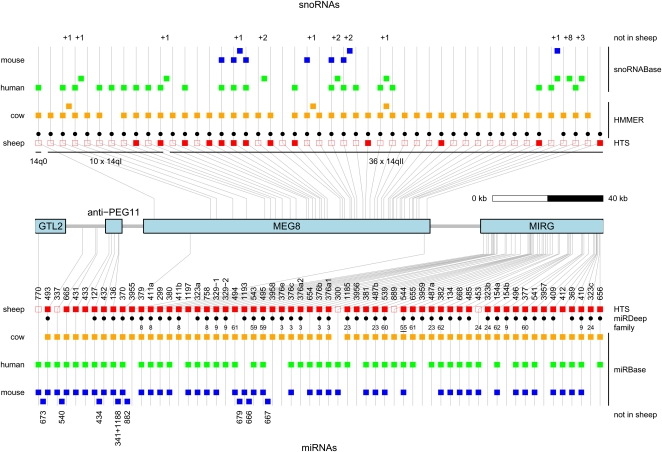
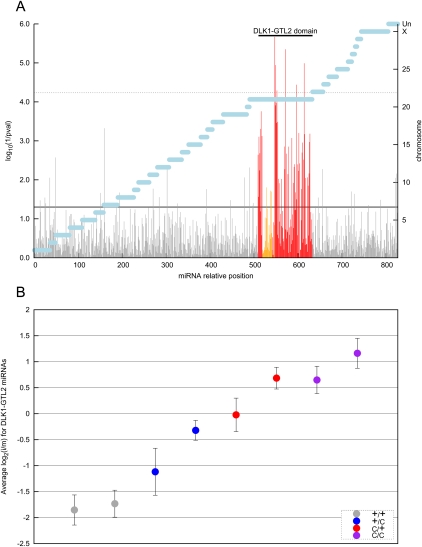
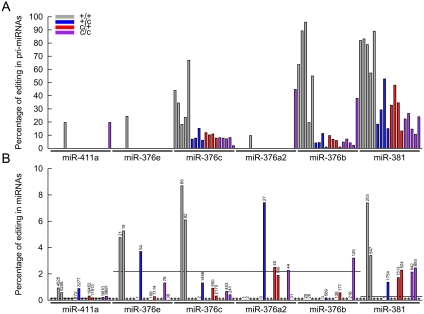
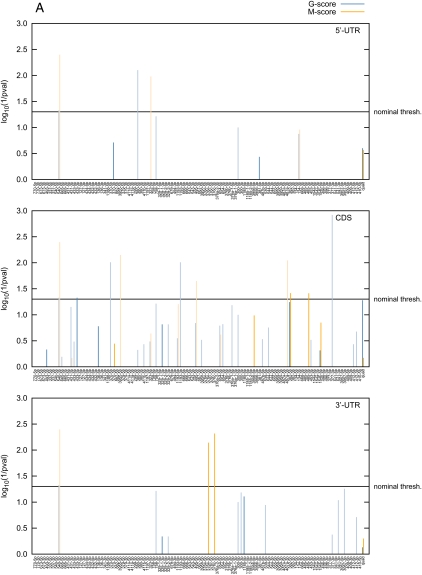
The callipyge phenotype is a monogenic muscular hypertrophy that is only expressed in heterozygous sheep receiving the CLPG mutation from their sire. The wild-type phenotype of CLPG/CLPG animals is thought to result from translational inhibition of paternally expressed DLK1 transcripts by maternally expressed miRNAs. To identify the miRNA responsible for this trans effect, we used high-throughput sequencing to exhaustively catalog miRNAs expressed in skeletal muscle of sheep of the four CLPG genotypes. We have identified 747 miRNA species of which 110 map to the DLK1-GTL2 or callipyge domain. We demonstrate that the latter are imprinted and preferentially expressed from the maternal allele. We show that the CLPG mutation affects their level of expression in cis (∼3.2-fold increase) as well as in trans (∼1.8-fold increase). In CLPG/CLPG animals, miRNAs from the DLK1-GTL2 domain account for ∼20% of miRNAs in skeletal muscle. We show that the CLPG genotype affects the levels of A-to-I editing of at least five pri-miRNAs of the DLK1-GTL2 domain, but that levels of editing of mature miRNAs are always minor. We present suggestive evidence that the miRNAs from the domain target the ORF of DLK1, thereby causing the trans inhibition underlying polar overdominance. We highlight the limitations of high-throughput sequencing for digital gene expression profiling as a result of biased and inconsistent amplification of specific miRNAs.


Figures

Figure 1.
Figure 1.
Comparative map of the small RNA genes in the DLK1–GTL2 domain: snoRNAs (upper panel) and miRNAs (lower panel). Square boxes correspond to small RNAs detected in sheep (red), cow (orange), human (green), and mouse (blue). Gray lines connect orthologs in the four species and indicate their chromosomal position with respect to the four long noncoding RNA genes in the domain: GTL2, anti-PEG11, MEG8, and MIRG. The position of precursors not detected in sheep is indicated by squares nested between vertical gray lines. The numbers above and below snoRNA and miRNA columns, respectively, correspond to numbers of additional paralogs for the snoRNAs (from +1 to +8) and names of additional miRNAs. The red squares are filled when reads for the corresponding small RNA were found in the conducted HTS experiments, empty when not. (Black dots) miRNAs predicted by miRDeep (Friedlander et al. 2008) in sheep. Numbers below the black dots identify the cluster/family to which the corresponding miRNA was assigned using the BLAST/MCL algorithm (Enright et al. 2002). The family number of miR-544 is underlined as the other members map outside of the DLK1–GTL2 domain. (Black dots) snoRNAs predicted by HMMER (Durbin et al. 1998) in sheep. snoRNAs in mouse and human correspond to predictions made by Cavaille et al. (2002). snoRNAs in the cow were predicted by HMMER (Durbin et al. 1998). miRNAs in cow, human, and mouse were extracted from miRBase (Griffiths-Jones 2006).
Figure 2.
Figure 2.
(A) Log10(1/p) values of the effect of CLPG genotype on the expression level of 851 small RNAs in skeletal muscle of eight 8-wk-old sheep. Expression levels were estimated from the number of Illumina GA reads from two independent HTS experiments. The statistical significance of the CLPG effect was estimated by ANOVA. Gray vertical bars correspond to miRNAs outside of the DLK1–GTL2 domain, red vertical bars to miRNAs from the DLK1–GTL2 domain, and orange vertical bars to small RNAs derived from C/D snoRNA precursors. Horizontal black lines correspond to the nominal (plain line) and Bonferroni-adjusted (dotted line) 5% significance thresholds. Horizontal blue bars mark the different chromosomes (right Y-axis). (UN) Unassigned sequence contigs. (B) Average expression level, relative to the mean expression level of seven individuals sequenced twice (HTS1 and HTS2), of 99 “regular” miRNAs (i.e., excluding small RNAs derived from C/D snoRNAs) from the DLK1–GTL2 domain in skeletal muscle of eight sheep sorted by CLPG genotype (gray: +/+; blue: +Mat/CLPGPat; red: CLPGMat/+Pat; purple: CLPG/CLPG). Error bars correspond to 1.96 × the standard error of the estimate.
Figure 3.
Figure 3.
(A) Percentage of A-to-I editing of pri-miRNAs at the “+5” position (pre-miR-411a) or “+44” position (pre-miR-376e, pre-miR-376c, pre-miR-376a2, pre-miR-381) in longissimus dorsi of 18 animals representing the four possible CLPG genotypes [gray: +/+ (5); blue: +Mat/CLPGPat (4); red: CLPGMat/+Pat (4); purple: CLPG/CLPG (5)]. The first two animals of each CLPG genotype were analyzed at 2 wk, the others at 8 wk. (B) Percentage of A-to-I editing of mature miRNAs at position “+5” (miR-411a = 5p), “+6” (miR-376e, miR-376c, miR-376a2, miR-376b = 3p), and “+5” (miR-381 = 3p). Animals are ordered as in A. (*) Animals without HTS data. The numbers above each column correspond to the total number of reads (edited + non-edited) available for analysis. The black horizontal lines correspond to the average level of A-to-G substitution observed for miRNAs derived from the 5p arm at position “+5” (miR-411a), from the 3p arm at position “+6” (miR-376e, miR-376c, miR-376a2, miR-376b), and from the 3p arm at position “+5” (miR-381).
Figure 4.
Figure 4.
(A) Statistical significance [log(1/p)] of the affinity of ovine miRNAs in the DLK1–GTL2 domain for the 5′-UTR, coding sequence (ORF), and 3′-UTR of the ovine DLK1. The affinity was measured using either G- (blue) or M-scores (orange) as defined in the text. Bars are dark colored for highly expressed and light colored for lowly expressed miRNAs. The last pair of bars (“quad”) at the right of the graph corresponds to the quadrille scores, the remaining bars to the species scores and are labeled accordingly. P-values were determined using the sequence-shuffling test described in the text. Species scores require a Bonferroni correction for 127 independent tests. (B) Position in the DLK1 mRNA of target sites (8-mers, 7-mers, and 6-mers as defined by Grimson et al. [2007]) for the same set of miRNA species. (C) Same as in A except that the scores are “multiorganism (MO) scores” combining information from sheep, human, and mouse.
Figure 4.
Figure 4.
(A) Statistical significance [log(1/p)] of the affinity of ovine miRNAs in the DLK1–GTL2 domain for the 5′-UTR, coding sequence (ORF), and 3′-UTR of the ovine DLK1. The affinity was measured using either G- (blue) or M-scores (orange) as defined in the text. Bars are dark colored for highly expressed and light colored for lowly expressed miRNAs. The last pair of bars (“quad”) at the right of the graph corresponds to the quadrille scores, the remaining bars to the species scores and are labeled accordingly. P-values were determined using the sequence-shuffling test described in the text. Species scores require a Bonferroni correction for 127 independent tests. (B) Position in the DLK1 mRNA of target sites (8-mers, 7-mers, and 6-mers as defined by Grimson et al. [2007]) for the same set of miRNA species. (C) Same as in A except that the scores are “multiorganism (MO) scores” combining information from sheep, human, and mouse.

References

    1. Ashburner M, Ball CA, Blake JA, Botstein D, Butler H, Cherry JM, Davis AP, Dolinski K, Dwight SS, Eppig JT, et al. 2000. Gene Ontology: Tool for the unification of biology. The Gene Ontology Consortium. Nat Genet 25: 25–29 - PMC - PubMed
    1. Baek D, Villen J, Shin C, Camargo FD, Gygi SP, Bartel DP 2008. The impact of microRNAs on protein output. Nature 455: 64–71 - PMC - PubMed
    1. Byrne K, Colgrave ML, Vuocolo T, Pearson R, Bidwell CA, Cockett NE, Lynn DJ, Fleming-Waddell JN, Tellam RL 2010. The imprinted retrotransposon-like gene PEG11 (RTL1) is expressed as a full-length protein in skeletal muscle from Callipyge sheep. PLoS ONE 5: e8638 doi: 10.1371/journal.pone.0008638 - PMC - PubMed
    1. Cavaille J, Seitz H, Paulsen M, Ferguson-Smith AC, Bachellerie JP 2002. Identification of tandemly-repeated C/D snoRNA genes at the imprinted human 14q32 domain reminiscent of those at the Prader-Willi/Angelman syndrome region. Hum Mol Genet 11: 1527–1538 - PubMed
    1. Charlier C, Segers K, Karim L, Shay T, Gyapay G, Cockett N, Georges M 2001a. The callipyge mutation enhances the expression of coregulated imprinted genes in cis without affecting their imprinting status. Nat Genet 27: 367–369 - PubMed

Publication types

Associated data