

The corollary discharge in humans is related to synchronous neural oscillations
- PMID: 20946054
- PMCID: PMC4155919
- DOI: 10.1162/jocn.2010.21589
The corollary discharge in humans is related to synchronous neural oscillations
Abstract
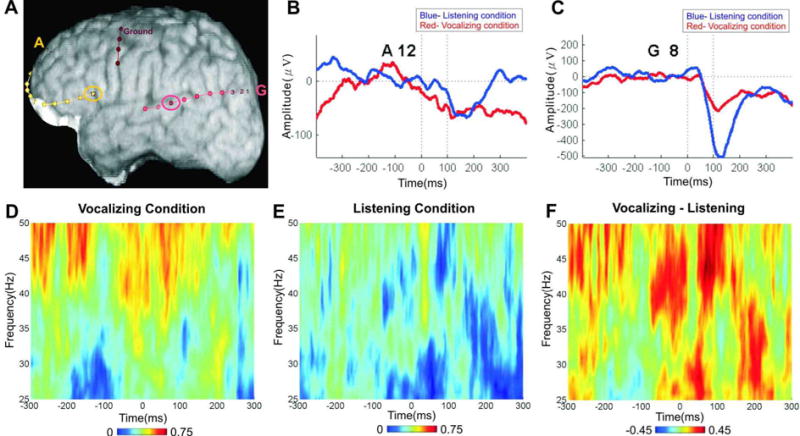
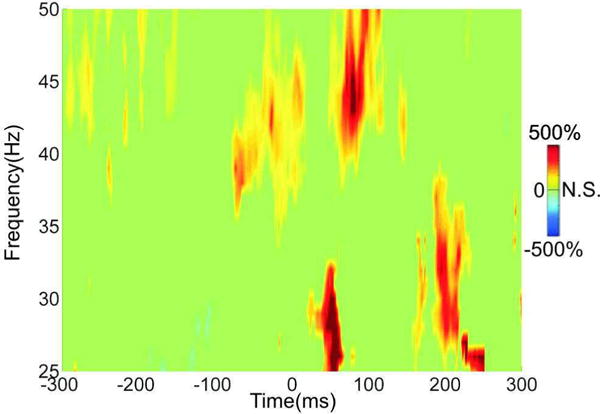
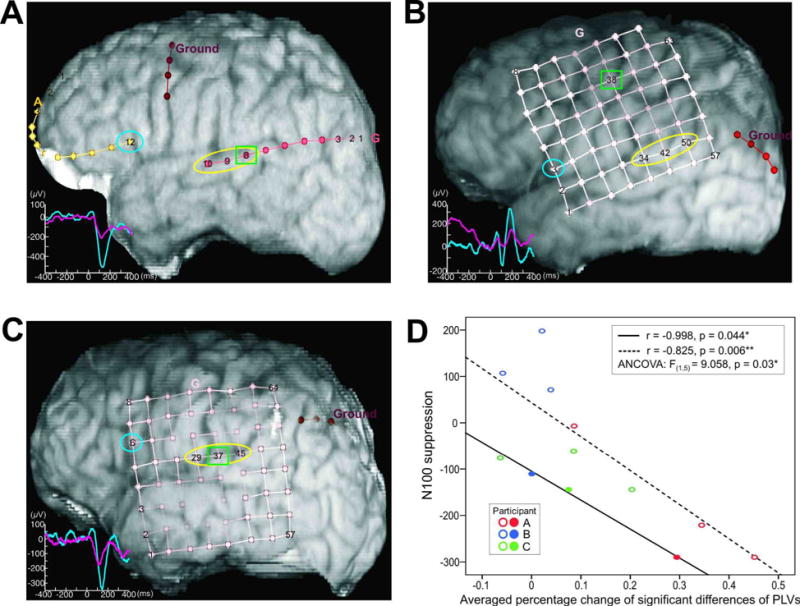
How do animals distinguish between sensations coming from external sources and those resulting from their own actions? A corollary discharge system has evolved that involves the transmission of a copy of motor commands to sensory cortex, where the expected sensation is generated. Through this mechanism, sensations are tagged as coming from self, and responsiveness to them is minimized. The present study investigated whether neural phase synchrony between motor command and auditory cortical areas is related to the suppression of the auditory cortical response. We recorded electrocorticograms from the human brain during a vocalizing/listening task. Neural phase synchrony between Broca's area and auditory cortex in the gamma band (35 to ∼50 Hz) in the 50-msec time window preceding speech onset was greater during vocalizing than during listening to a playback of the same spoken sounds. Because prespeech neural synchrony was correlated (r = -.83, p = .006), with the subsequent suppression of the auditory cortical response to the spoken sound, we hypothesize that phase synchrony in the gamma band between Broca's area and auditory cortex is the neural instantiation of the transmission of a copy of motor commands. We suggest that neural phase synchrony of gamma frequencies may contribute to transmission of corollary discharges in humans.
Figures
Similar articles
-
Action planning and predictive coding when speaking.Neuroimage. 2014 May 1;91:91-8. doi: 10.1016/j.neuroimage.2014.01.003. Epub 2014 Jan 11. Neuroimage. 2014. PMID: 24423729 Free PMC article.
-
Synch before you speak: auditory hallucinations in schizophrenia.Am J Psychiatry. 2007 Mar;164(3):458-66. doi: 10.1176/ajp.2007.164.3.458. Am J Psychiatry. 2007. PMID: 17329471
-
Modulation of response patterns in human auditory cortex during a target detection task: an intracranial electrophysiology study.Int J Psychophysiol. 2015 Feb;95(2):191-201. doi: 10.1016/j.ijpsycho.2014.03.006. Epub 2014 Mar 25. Int J Psychophysiol. 2015. PMID: 24681353 Free PMC article.
-
Corollary discharge dysfunction in schizophrenia: can it explain auditory hallucinations?Int J Psychophysiol. 2005 Nov-Dec;58(2-3):179-89. doi: 10.1016/j.ijpsycho.2005.01.014. Epub 2005 Aug 31. Int J Psychophysiol. 2005. PMID: 16137779 Review.
-
Speaking-Induced Suppression of the Auditory Cortex in Humans and Its Relevance to Schizophrenia.Biol Psychiatry Cogn Neurosci Neuroimaging. 2019 Sep;4(9):791-804. doi: 10.1016/j.bpsc.2019.05.011. Epub 2019 May 30. Biol Psychiatry Cogn Neurosci Neuroimaging. 2019. PMID: 31399393 Review.
Cited by
-
The phenomenology of auditory verbal hallucinations in schizophrenia and the challenge from pseudohallucinations.Front Psychiatry. 2022 Aug 16;13:826654. doi: 10.3389/fpsyt.2022.826654. eCollection 2022. Front Psychiatry. 2022. PMID: 36051554 Free PMC article.
-
Insights into cortical oscillations arising from optogenetic studies.Biol Psychiatry. 2012 Jun 15;71(12):1039-45. doi: 10.1016/j.biopsych.2012.01.024. Epub 2012 Mar 3. Biol Psychiatry. 2012. PMID: 22381731 Free PMC article. Review.
-
Single-Trial Classification of Disfluent Brain States in Adults Who Stutter.Conf Proc IEEE Int Conf Syst Man Cybern. 2018 Oct;2018:10.1109/smc.2018.00019. doi: 10.1109/smc.2018.00019. Epub 2019 Jan 17. Conf Proc IEEE Int Conf Syst Man Cybern. 2018. PMID: 34720566 Free PMC article.
-
Action planning and predictive coding when speaking.Neuroimage. 2014 May 1;91:91-8. doi: 10.1016/j.neuroimage.2014.01.003. Epub 2014 Jan 11. Neuroimage. 2014. PMID: 24423729 Free PMC article.
-
Pons-to-Cerebellum Hypoconnectivity Along the Psychosis Spectrum and Associations With Sensory Prediction and Hallucinations in Schizophrenia.Biol Psychiatry Cogn Neurosci Neuroimaging. 2024 Jul;9(7):693-702. doi: 10.1016/j.bpsc.2024.01.010. Epub 2024 Feb 2. Biol Psychiatry Cogn Neurosci Neuroimaging. 2024. PMID: 38311290 Free PMC article.
References
-
- Arieli A, Sterkin A, Grinvald A, Aertsen A. Dynamics of ongoing activity: Explanation of the large variability in evoked cortical responses. Science. 1996;273:1868–1871. - PubMed
-
- Artacho-Perula E, Arbizu J, Arroyo-Jimenez MM, Marcos P, Martinez-Marcos A, Blaizot X, et al. Quantitative estimation of the primary auditory cortex in human brains. Brain Res. 2004;1008:20–28. - PubMed
-
- Basar-Eroglu C, Struber D, Schurmann M, Stadler M, Basar E. Gamma-band responses in the brain: a short review of psychophysiological correlates and functional significance. Int J Psychophysiol. 1996;24:101–112. - PubMed
-
- Bastiaansen MCM, Hagoort P. Oscillatory brain dynamics during language comprehension. In: Klimesch W, Neuper C, editors. Event-related dynamics of brain oscillations. Amsterdam: Elsevier; 2006.
-
- Bell CC. An efference copy which is modified by reafferent input. Science. 1981;214:450–453. - PubMed