. 2011 Mar;13(3):563-575.
doi: 10.1111/j.1462-2920.2010.02357.x. Epub 2010 Oct 15.

ppGpp is the major source of growth rate control in E. coli

Affiliations

ppGpp is the major source of growth rate control in E. coli

Katarzyna Potrykus et al. Environ Microbiol. 2011 Mar.

Abstract

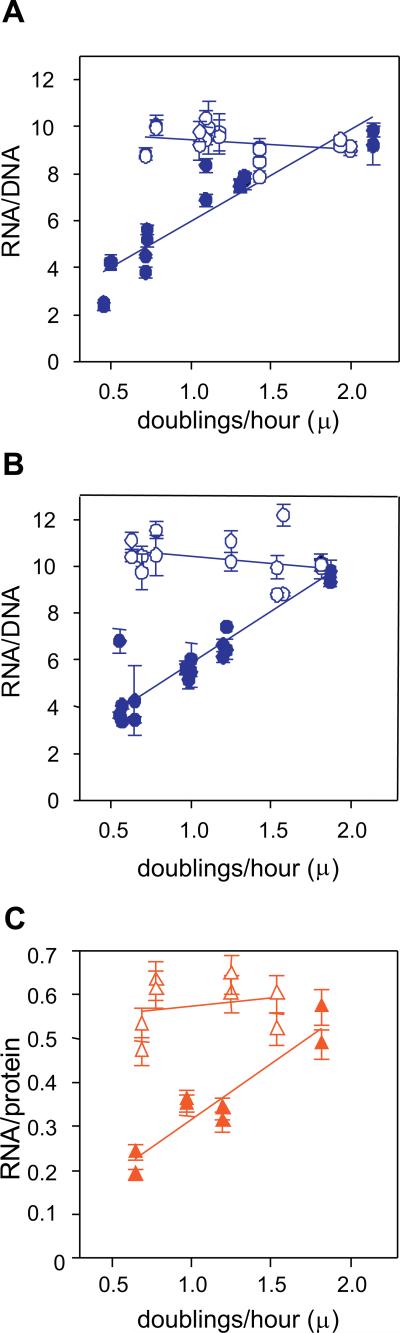
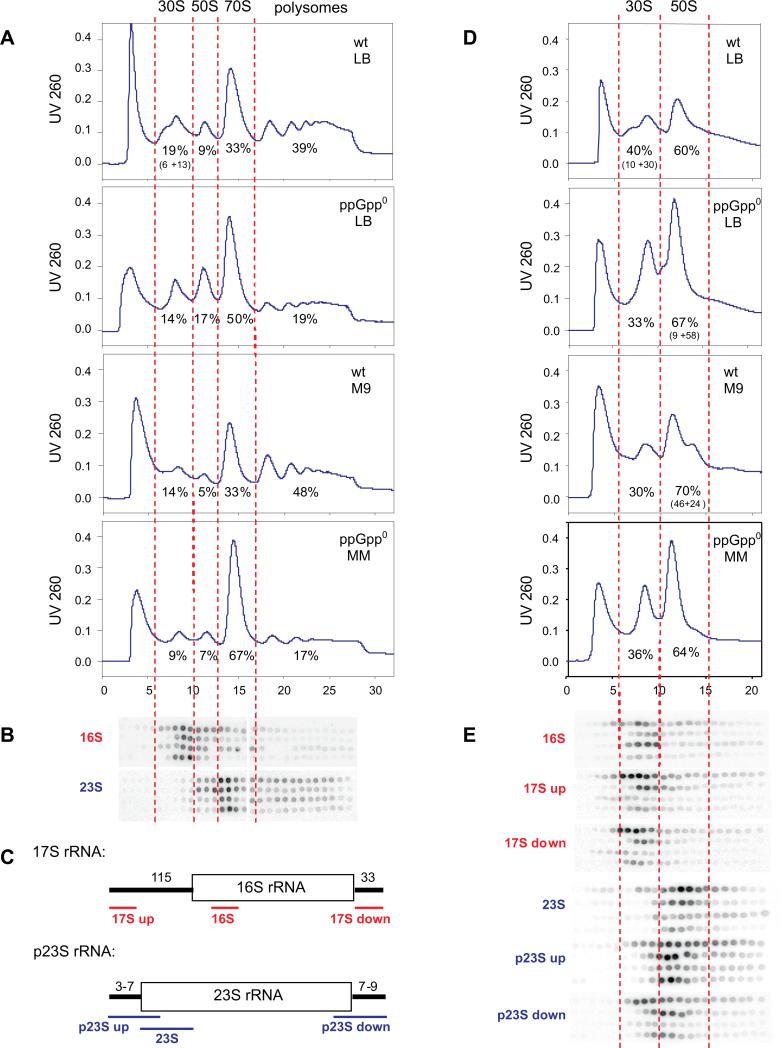
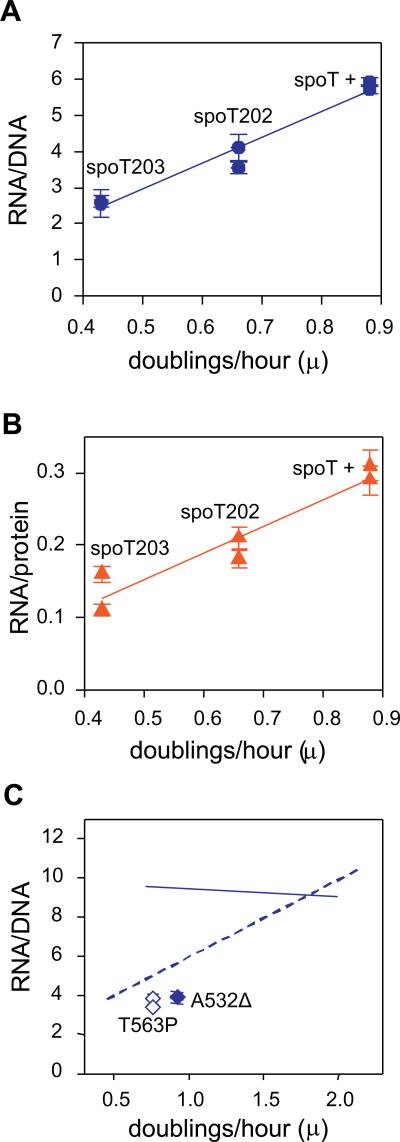
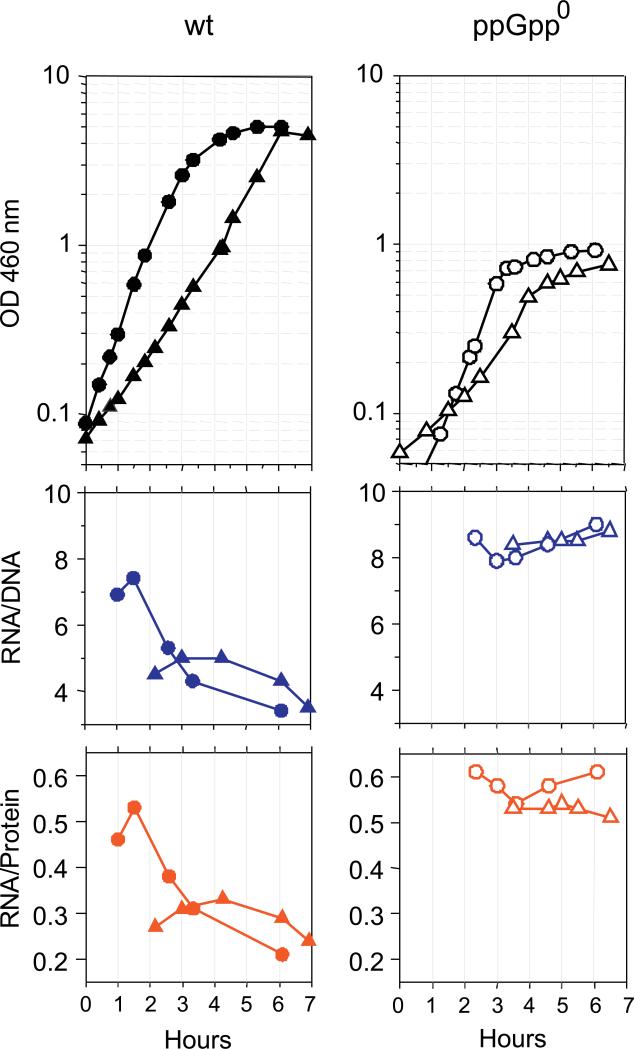
It is widely accepted that the DNA, RNA and protein content of Enterobacteriaceae is regulated as a function of exponential growth rates; macromolecular content increases with faster growth regardless of specific composition of the growth medium. This phenomenon, called growth rate control, primarily involves regulation of ribosomal RNA and ribosomal protein synthesis. However, it was uncertain whether the global regulator ppGpp is the major determinant for growth rate control. Therefore, here we re-evaluate the effect of ppGpp on macromolecular content for different balanced growth rates in defined media. We find that when ppGpp is absent, RNA/protein and RNA/DNA ratios are equivalent in fast and slow growing cells. Moreover, slow growing ppGpp-deficient cells with increased RNA content, display a normal ribosomal subunit composition although polysome content is reduced when compared with fast growing wild-type cells. From this we conclude that growth rate control does not occur in the absence of ppGpp. Also, artificial elevation of ppGpp or introduction of stringent RNA polymerase mutants in ppGpp-deficient cells restores this control. We believe these findings strongly argue in favour of ppGpp and against redundant regulation of growth rate control by other factors in Escherichia coli and other enteric bacteria.


Figures

Figure 1
Figure 1. A ppGpp deficiency abolishes regulation of RNA/DNA and RNA/protein ratios as a function of growth rate
Isogenic strains differing in the presence of ppGpp were grown in different media (Table I) to achieve a range of balanced growth rates from about 120 min/doubling (μ = 0.5) to about 30 min/doubling (μ = 2). Cellular RNA and DNA content were measured by a fluorescent assay. Filled symbols correspond to wt strains, open symbols correspond to ppGpp0 strains. The solid lines represent linear regressions calculated with SigmaPlot software. (A) the wt (CF1648) and mutant (CF1693 = CF1648 ΔrelA251 ΔspoT207) strain are basically the same as used in earlier conflicting reports regarding the role of ppGpp in growth rate control (Gaal and Gourse, 1990; Hernandez and Bremer, 1993). (B) the wt (CF7968) and mutant (CF12257) strains used here are thought to be improved over the strains used in (A) with respect to the absence of polar effects due to insertions (ΔrelA256 ΔspoT212) and elimination of the leaky uracil requirement (see text for details) (C) Selected cell lysate samples from (B) were assayed to measure RNA/protein ratios.
Figure 2
Figure 2. A ppGpp deficiency lowers polysomes abundance without ribosome maturation defects
(A) Sucrose gradient profiles of wt (CF1648) and ppGpp0 (CF1693) strains grown in rich (LB) and poor media(M9= medium #9; MM= medium #8 (Table I)) under associating conditions monitored by A260. Percent abundance is indicated below peaks of 30S, 50S, 70S and polysomes. Values in parenthesis indicate fractions of unusual minor peaks. Percentages and error estimates for samples from three independent cultures for each panel are presented in Supplementary Table I. The peak at the very top of the gradient contains non-ribosomal UV adsorbing material; its abundance is not reproducible and thus not considered here. (B) Fractions collected from panel (A) were also subjected to dot blot analysis with 16S and 23S probes. The red dashed lines align the fractions analyzed. Groups of rows reflect the same strain and medium order as profiles in panel (A). (C) Schematic representation of the probes used, not drawn to scale. The positions of probes relative to mature 16S (red) and 23S (blue) sequences are shown. (D) The same samples as in (A) but subjected to dissociating gradient conditions, where polysomes and 70S particles are converted to ribosomal subunits. (E) As panel (B) but also including probes for premature subunits, as depicted in panel (C).
Figure 3
Figure 3. Gratuitous induction of ppGpp or stringent RNA polymerase mutants restore growth rate control
Gratuitous induction of ppGpp in the absence of starvation is achieved by point mutations in spoT, which in turn slows growth rate. (A) RNA/DNA ratios were measured as in Figure 1A. Solid line represents linear regression calculated with SigmaPlot software. The slope of the line approximates the value shown in Fig. 1 for wt cells. The strains were grown in medium #9 (Table I) (B) RNA/protein ratios were measured as in Figure 1C. The solid line represents linear regression calculated with SigmaPlot software. The slope of the line again approximates the value shown in Figure 1C for wt cells, given that the spoT203 mutant grows more slowly than the wt in the poorest medium. (C) Two stringent RNA polymerase mutants in a ppGpp0 host (rpoB A532Δ = B3449, and rpoB T563P = B3370) were grown in medium # 8 (Table I). Solid and dashed lines represent linear regressions obtained for ppGpp0 and wt strains in Figure 1A, respectively.
Figure 4
Figure 4. Changes in RNA/DNA and RNA/protein ratios during entry into stationary phase
Filled symbols represent wt strains (CF7968), open symbols represent ppGpp0 strains (CF12257). Both strains were grown in rich (circles) or in poor (triangles) growth media (as defined in Table I). For wt: medium # 9 (poor) and #4 (rich); for ppGpp0: #6 (poor) and # 4 (rich). Upper panels depict changes in cell density, middle panels RNA/DNA ratios and lower panels RNA/protein ratios.
Figure 5
Figure 5. Changes in RNA/DNA ratios during entry into stationary phase in LB
Numbers with arrows represent RNA/DNA ratios measured at the indicated points of growth. Panels (A) and (B) allow the comparison of the effects of ppGpp, contrasted with the deficiency of dksA (wt is CF1648; ppGpp0 is CF1693; dksA is CF9239) (C). Panels (D) and (E) compare the effects of DksA overexpression on a multicopy plasmid from its natural promoter (pDksA= pJK537) and pBR322 (vector control). The extent of overexpression of DksA at early stationary phase is shown by the Western blot with an RpoA loading control, in panel (F). Quantitation relative to wt vector control is shown beneath each lane.

Similar articles

Cited by

References

    1. Aberg A, Shingler V, Balsalobre C. Regulation of the fimB promoter: a case of differential regulation by ppGpp and DksA in vivo. Mol Microbiol. 2008;67:1223–1241. - PubMed
    1. Baracchini E, Bremer H. Control of rRNA synthesis in Escherichia coli at increased rrn gene dosage. Role of guanosine tetraphosphate and ribosome feedback. J Biol Chem. 1991;266:11753–11760. - PubMed
    1. Blankschein MD, Potrykus K, Grace E, Choudhary A, Vinella D, Cashel M, Herman C. TraR, a homolog of a RNAP secondary channel interactor, modulates transcription. PLoS Genet. 2008;5(1):e1000345. doi:10.1371/journal.pgen.1000345. - PMC - PubMed
    1. Bugl H, Fauman EB, Staker BL, Zheng F, Kushner SR, Saper MA, Bardwell JCA, Jakob U. RNA methylation under heat shock control. Mol Cell. 2000;6:349–360. - PubMed
    1. Bremer H, Dennis PP. Modulation of chemical composition and other parameters of the cell by growth rate. In: Neidhardt FC, editor. Escherichia coli and Salmonella: cellular and molecular biology. ASM Press; Washington DC: 1996. pp. 1553–1569.

Publication types

MeSH terms