

Evaluation of gene expression data generated from expired Affymetrix GeneChip® microarrays using MAQC reference RNA samples
- PMID: 20946593
- PMCID: PMC3026357
- DOI: 10.1186/1471-2105-11-S6-S10
Evaluation of gene expression data generated from expired Affymetrix GeneChip® microarrays using MAQC reference RNA samples
Abstract
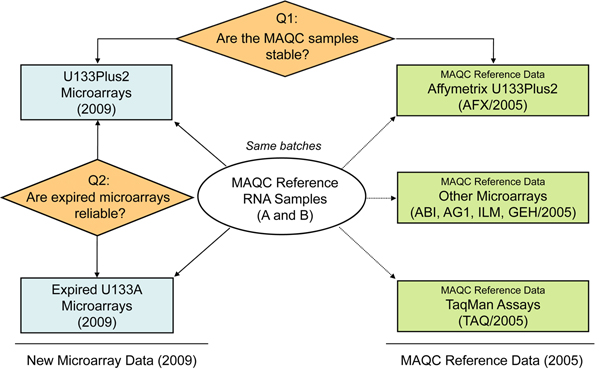
Background: The Affymetrix GeneChip® system is a commonly used platform for microarray analysis but the technology is inherently expensive. Unfortunately, changes in experimental planning and execution, such as the unavailability of previously anticipated samples or a shift in research focus, may render significant numbers of pre-purchased GeneChip® microarrays unprocessed before their manufacturer's expiration dates. Researchers and microarray core facilities wonder whether expired microarrays are still useful for gene expression analysis. In addition, it was not clear whether the two human reference RNA samples established by the MAQC project in 2005 still maintained their transcriptome integrity over a period of four years. Experiments were conducted to answer these questions.
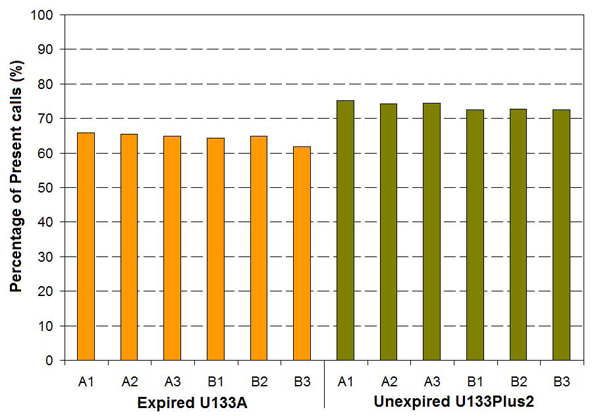
Results: Microarray data were generated in 2009 in three replicates for each of the two MAQC samples with either expired Affymetrix U133A or unexpired U133Plus2 microarrays. These results were compared with data obtained in 2005 on the U133Plus2 microarray. The percentage of overlap between the lists of differentially expressed genes (DEGs) from U133Plus2 microarray data generated in 2009 and in 2005 was 97.44%. While there was some degree of fold change compression in the expired U133A microarrays, the percentage of overlap between the lists of DEGs from the expired and unexpired microarrays was as high as 96.99%. Moreover, the microarray data generated using the expired U133A microarrays in 2009 were highly concordant with microarray and TaqMan® data generated by the MAQC project in 2005.
Conclusions: Our results demonstrated that microarray data generated using U133A microarrays, which were more than four years past the manufacturer's expiration date, were highly specific and consistent with those from unexpired microarrays in identifying DEGs despite some appreciable fold change compression and decrease in sensitivity. Our data also suggested that the MAQC reference RNA samples, stored at -80°C, were stable over a time frame of at least four years.
Figures


Similar articles
-
Cross-platform comparison of SYBR Green real-time PCR with TaqMan PCR, microarrays and other gene expression measurement technologies evaluated in the MicroArray Quality Control (MAQC) study.BMC Genomics. 2008 Jul 11;9:328. doi: 10.1186/1471-2164-9-328. BMC Genomics. 2008. PMID: 18620571 Free PMC article.
-
Reproducibility of microarray data: a further analysis of microarray quality control (MAQC) data.BMC Bioinformatics. 2007 Oct 25;8:412. doi: 10.1186/1471-2105-8-412. BMC Bioinformatics. 2007. PMID: 17961233 Free PMC article.
-
Transcriptome sequencing of the Microarray Quality Control (MAQC) RNA reference samples using next generation sequencing.BMC Genomics. 2009 Jun 12;10:264. doi: 10.1186/1471-2164-10-264. BMC Genomics. 2009. PMID: 19523228 Free PMC article.
-
Reproducible and reliable microarray results through quality control: good laboratory proficiency and appropriate data analysis practices are essential.Curr Opin Biotechnol. 2008 Feb;19(1):10-8. doi: 10.1016/j.copbio.2007.11.003. Epub 2007 Dec 26. Curr Opin Biotechnol. 2008. PMID: 18155896 Review.
-
Standards in gene expression microarray experiments.Methods Enzymol. 2006;411:63-78. doi: 10.1016/S0076-6879(06)11005-8. Methods Enzymol. 2006. PMID: 16939786 Review.
Cited by
-
Imputing gene expression to maximize platform compatibility.Bioinformatics. 2017 Feb 15;33(4):522-528. doi: 10.1093/bioinformatics/btw664. Bioinformatics. 2017. PMID: 27797771 Free PMC article.
-
Atlas of RNA sequencing profiles for normal human tissues.Sci Data. 2019 Apr 23;6(1):36. doi: 10.1038/s41597-019-0043-4. Sci Data. 2019. PMID: 31015567 Free PMC article.
-
GeneCompete: an integrative tool of a novel union algorithm with various ranking techniques for multiple gene expression data.PeerJ Comput Sci. 2023 Nov 15;9:e1686. doi: 10.7717/peerj-cs.1686. eCollection 2023. PeerJ Comput Sci. 2023. PMID: 38077583 Free PMC article.
-
Transcriptomic Harmonization as the Way for Suppressing Cross-Platform Bias and Batch Effect.Biomedicines. 2022 Sep 18;10(9):2318. doi: 10.3390/biomedicines10092318. Biomedicines. 2022. PMID: 36140419 Free PMC article. Review.
-
A generic Transcriptomics Reporting Framework (TRF) for 'omics data processing and analysis.Regul Toxicol Pharmacol. 2017 Dec;91 Suppl 1(Suppl 1):S36-S45. doi: 10.1016/j.yrtph.2017.11.001. Epub 2017 Nov 4. Regul Toxicol Pharmacol. 2017. PMID: 29113939 Free PMC article. Review.
References
-
- Shi L, Perkins RG, Tong W. In: Microarrays: Preparation, Microfluidics, Detection methods, and Biological Applications. Dill K, Liu R, Grodzinski P., editor. New York: Springer; 2008. The Current Status of DNA Microarrays; pp. 3–24.
Publication types
MeSH terms
Substances
Associated data
- Actions
LinkOut - more resources
Full Text Sources
Molecular Biology Databases
Miscellaneous
