. 2010 Oct 7;11 Suppl 6(Suppl 6):S8.
doi: 10.1186/1471-2105-11-S6-S8.

Identification of diagnostic subnetwork markers for cancer in human protein-protein interaction network

Affiliations

Identification of diagnostic subnetwork markers for cancer in human protein-protein interaction network

Junjie Su et al. BMC Bioinformatics. .

Abstract

Background: Finding reliable gene markers for accurate disease classification is very challenging due to a number of reasons, including the small sample size of typical clinical data, high noise in gene expression measurements, and the heterogeneity across patients. In fact, gene markers identified in independent studies often do not coincide with each other, suggesting that many of the predicted markers may have no biological significance and may be simply artifacts of the analyzed dataset. To find more reliable and reproducible diagnostic markers, several studies proposed to analyze the gene expression data at the level of groups of functionally related genes, such as pathways. Studies have shown that pathway markers tend to be more robust and yield more accurate classification results. One practical problem of the pathway-based approach is the limited coverage of genes by currently known pathways. As a result, potentially important genes that play critical roles in cancer development may be excluded. To overcome this problem, we propose a novel method for identifying reliable subnetwork markers in a human protein-protein interaction (PPI) network.

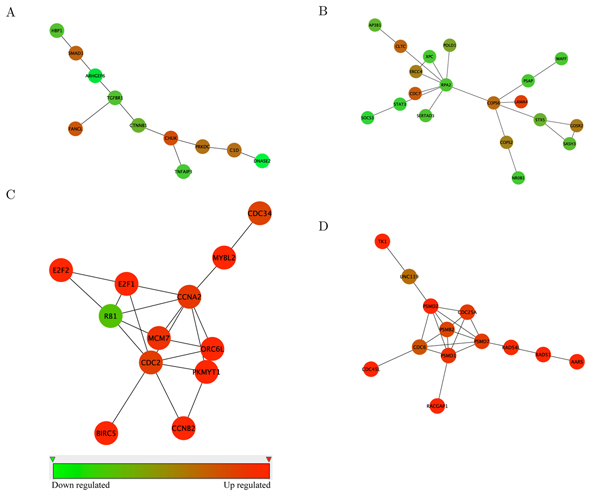
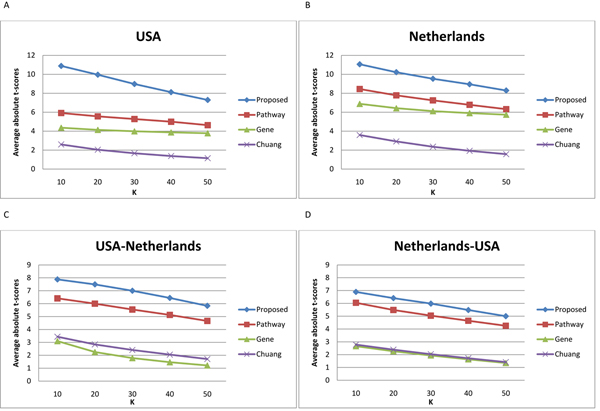
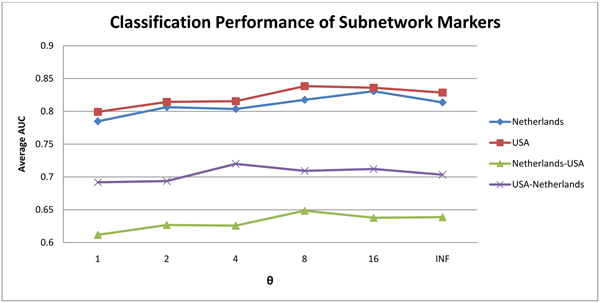
Results: In this method, we overlay the gene expression data with the PPI network and look for the most discriminative linear paths that consist of discriminative genes that are highly correlated to each other. The overlapping linear paths are then optimally combined into subnetworks that can potentially serve as effective diagnostic markers. We tested our method on two independent large-scale breast cancer datasets and compared the effectiveness and reproducibility of the identified subnetwork markers with gene-based and pathway-based markers. We also compared the proposed method with an existing subnetwork-based method.

Conclusions: The proposed method can efficiently find reliable subnetwork markers that outperform the gene-based and pathway-based markers in terms of discriminative power, reproducibility and classification performance. Subnetwork markers found by our method are highly enriched in common GO terms, and they can more accurately classify breast cancer metastasis compared to markers found by a previous method.


Figures

Figure 1
Figure 1
Sample subnetworks identified using the proposed method. (A), (B) are examples of subnetworks identified using the USA dataset. (C), (D) are examples of subnetworks identified using the Netherlands dataset. Red (green) implies that the gene is upregulated (downregulated) in breast cancer samples with metastasis.
Figure 2
Figure 2
Discriminative power of the subnetwork markers identified by the proposed method using different θ. We computed the mean absolute t-score of the top K = 10, 20, 30, 40, 50 subnetwork markers for different values of θ (shown in different colors). (A), (B): Markers were identified using a particular dataset and tested on the same dataset. (C), (D): Markers were identified using the first dataset and evaluated on the second dataset.
Figure 3
Figure 3
Discriminative power of different types of markers. We evaluated the discriminative power of the subnetwork markers identified using the proposed method, and compared them with gene markers, pathway markers [24], and the subnetwork markers identified by Chuang et al. [25]. Mean absolute t-score is shown for the top K = 10, 20, 30, 40, 50 markers. (A), (B): Markers were identified using a particular dataset and tested on the same dataset. (C), (D): Markers were identified using the first dataset and evaluated based on the second dataset.
Figure 4
Figure 4
Classification performance of the identified subnetwork markers for different θ. The line plots show the average AUC for classifiers based on subnetwork markers identified using θ = 1, 2, 4, 8, 16, ∞. The legends USA, Netherlands denote the results of within-dataset experiments based on the USA dataset and the Netherlands dataset, respectively. The legends USA-Netherlands, Netherlands-USA denote the results of cross-dataset experiments where markers were identified based on the first dataset and tested based on the second dataset.
Figure 5
Figure 5
Classification performance of different types of markers. The bar charts show the average AUC of different classifiers that use subnetwork markers identified by the proposed method, gene markers, pathway markers, and subnetwork markers found by Chuang et al.’s method. Results of the within-dataset experiments based on the USA and Netherlands dataset are shown in the two bar charts on the left. The two bar charts on the right show the results of the cross-dataset experiments, where markers were identified based on the first dataset and tested based on the second dataset.
Figure 6
Figure 6
Classification error at different TPR (true positive rate) for different types of markers. (A), (B) show the results of the within-dataset experiments based on the USA dataset and the Netherlands dataset, respectively. (C), (D) show the results of the cross-dataset experiments, where markers were identified using the first dataset and tested based on the second dataset.
Figure 7
Figure 7
Illustration of the proposed method.

References

    1. Efron B, Tibshirani R. Empirical bayes methods and false discovery rates for microarrays. Genet. Epidemiol. 2002;23:70–86. doi: 10.1002/gepi.1124. - DOI - PubMed
    1. Baldi P, Long AD. A Bayesian framework for the analysis of microarray expression data: regularized t-test and statistical inferences of gene changes. Bioinformatics. 2001;17:509–519. doi: 10.1093/bioinformatics/17.6.509. - DOI - PubMed
    1. Kepler TB, Crosby L, Morgan KT. Normalization and analysis of DNA microarray data by self-consistency and local regression. Genome Biol. 2002;3 doi: 10.1186/gb-2002-3-7-research0037. RESEARCH0037. - DOI - PMC - PubMed
    1. Ideker T, Thorsson V, Siegel AF, Hood LE. Testing for differentially-expressed genes by maximum-likelihood analysis of microarray data. J. 2000;7:805–817. doi: 10.1089/10665270050514945. - DOI - PubMed
    1. Chen Y, Dougherty ER, Bittner ML. Ratio-based decisions and the quantitative analysis of cDNA microarray images. Journal of Biomedical Optics. 1997;2:364–374. doi: 10.1117/12.281504. - DOI - PubMed