. 2010 Oct 15:7:68.
doi: 10.1186/1742-2094-7-68.

Krüppel-like factor 4, a novel transcription factor regulates microglial activation and subsequent neuroinflammation

Affiliations

Krüppel-like factor 4, a novel transcription factor regulates microglial activation and subsequent neuroinflammation

Deepak K Kaushik et al. J Neuroinflammation. .

Abstract

Background: Activation of microglia, the resident macrophages of the central nervous system (CNS), is the hallmark of neuroinflammation in neurodegenerative diseases and other pathological conditions associated with CNS infection. The activation of microglia is often associated with bystander neuronal death. Nuclear factor-κB (NF-κB) is one of the important transcription factors known to be associated with microglial activation which upregulates the expression of inducible nitric oxide synthase (iNOS), cyclooxygenase-2 (Cox-2) and other pro-inflammatory cytokines. Recent studies have focused on the role of Krüppel-like factor 4 (Klf4), one of the zinc-finger transcription factors, in mediating inflammation. However, these studies were limited to peripheral system and its role in CNS is not understood. Our studies focused on the possible role of Klf4 in mediating CNS inflammation.

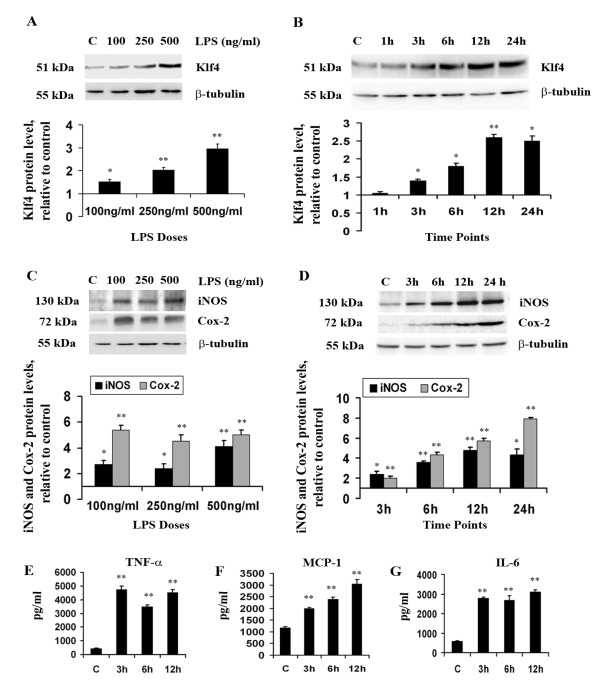
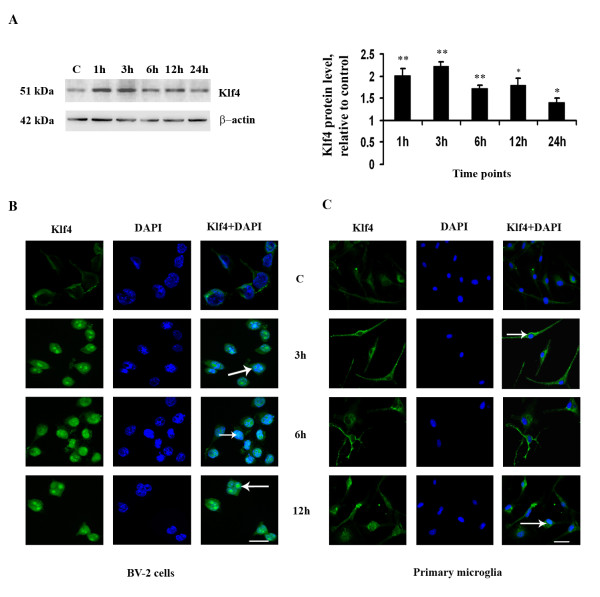
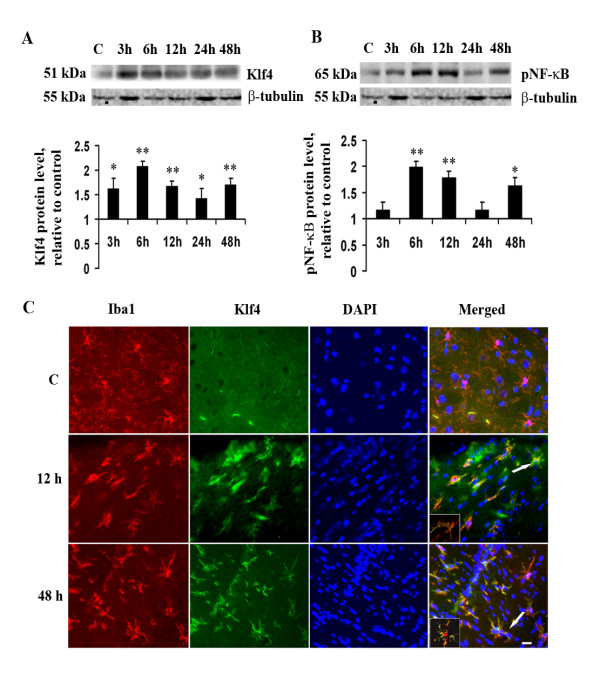
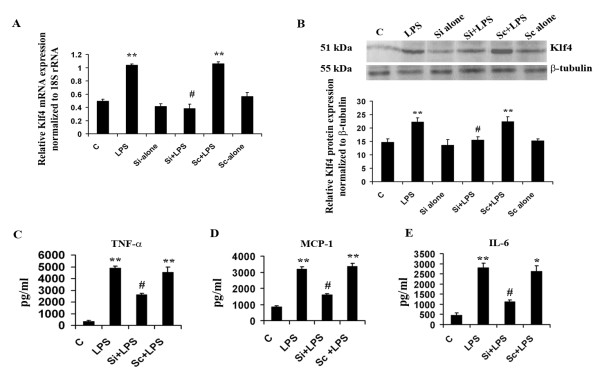
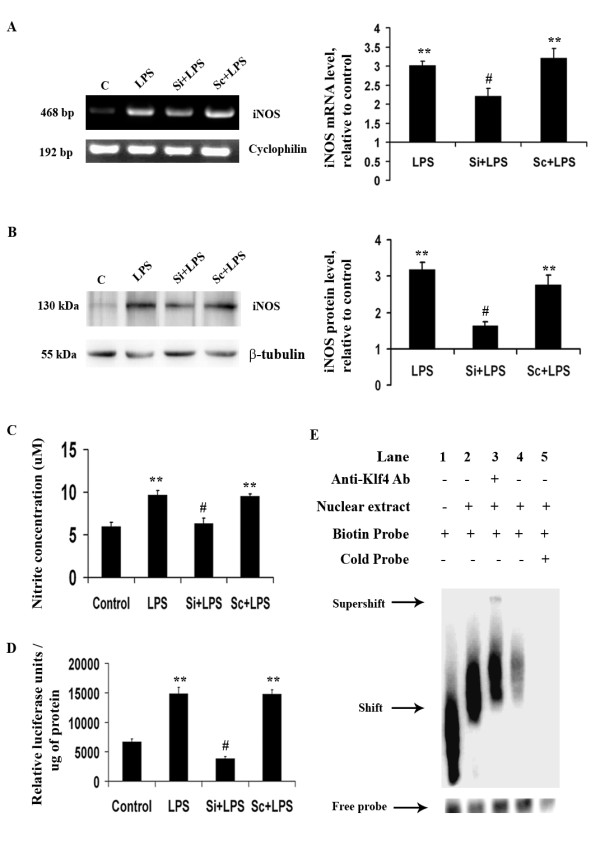
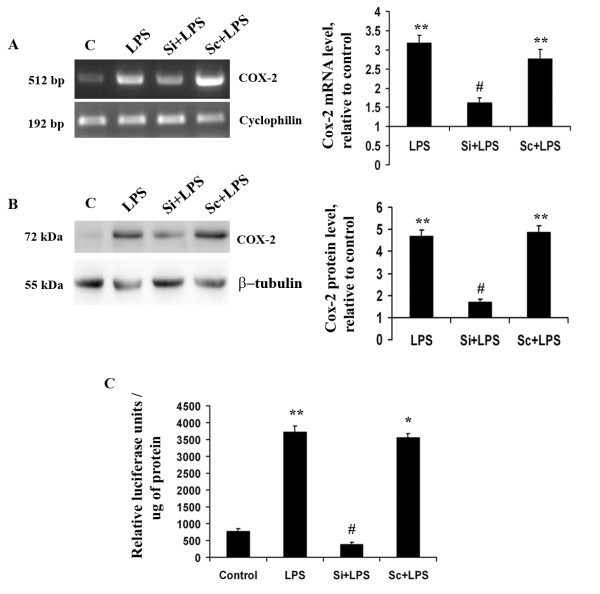
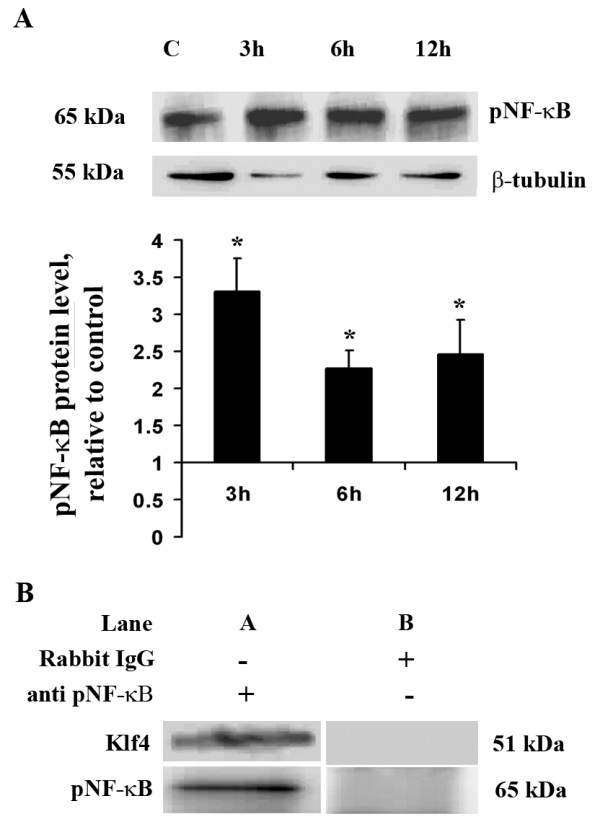
Methods: For in vitro studies, mouse microglial BV-2 cell lines were treated with 500 ng/ml Salmonella enterica lipopolysacchride (LPS). Brain tissues were isolated from BALB/c mice administered with 5 mg/kg body weight of LPS. Expressions of Klf4, Cox-2, iNOS and pNF-κB were evaluated using western blotting, quantitative real time PCR, and reverse transcriptase polymerase chain reactions (RT-PCRs). Klf4 knockdown was carried out using SiRNA specific for Klf4 mRNA and luciferase assays and electromobility shift assay (EMSA) were performed to study the interaction of Klf4 to iNOS promoter elements in vitro. Co-immunoprecipitation of Klf4 and pNF-κB was done in order to study a possible interaction between the two transcription factors.

Results: LPS stimulation increased Klf4 expression in microglial cells in a time- and dose-dependent manner. Knockdown of Klf4 resulted in decreased levels of the pro-inflammatory cytokines TNF-α, MCP-1 and IL-6, along with a significant decrease in iNOS and Cox-2 expression. NO production also decreased as a result of Klf4 knockdown. We found that Klf4 can potentially interact with pNF-κB and is important for iNOS and Cox-2 promoter activity in vitro.

Conclusions: These studies demonstrate the role of Klf4 in microglia in mediating neuroinflammation in response to the bacterial endotoxin LPS.


Figures

Figure 1
Figure 1
Klf4 expression and inflammation in BV-2 microglial cells upon LPS stimulation. Total cellular extract isolated from cells treated with different doses of LPS and for different time points were analyzed by immunoblot. (A and B) A significant increase is seen in Klf4 expression in a dose-dependent (A) and time dependent-manner (B) compared to untreated control samples. (C and D) There are significant increases in iNOS and Cox-2 levels in dose- (C) and time-dependent (D) manners in cells treated with LPS. The graphs represent protein levels relative to untreated controls. (E-G) Increase in pro-inflammatory cytokines upon LPS stimulation. Cytokine bead arrays were carried out to estimate the concentrations of TNF-α (E), MCP-1 (F) and IL-6 (G) in BV-2 cells treated for different time points. There were significant increases in all of these pro-inflammatory cytokines upon LPS treatment. Absolute values of these cytokines are given as pg/ml. *, **, Statistical differences in comparison to control values (* p < 0.05; ** p < 0.01).
Figure 2
Figure 2
Nuclear expression and translocation of Klf4 in response to LPS. Immunoblotting was carried out for nuclear extracts from LPS-treated BV-2 cells in a time-dependent manner. (A) A significant increase is observed in Klf4 levels in nuclear extracts at the 1 h and 3 h time points. The graph represents nuclear Klf4 protein levels relative to untreated controls. *, **, Statistical differences in comparison to control values (* p < 0.05; ** p < 0.01). For nuclear translocation studies, immunofluorescence for Klf4 was carried out in BV-2 cells and primary microglia. (B) Increased expression and nuclear translocation of Klf4 in BV-2 cells at 3 h, 6 h and 12 h time points, indicated by arrows. (C) Increased expression of Klf4 in mouse primary microglia cells and nuclear localization of Klf4 at the 12 h time point are indicated by arrows. Scale bar: 20 μm.
Figure 3
Figure 3
Klf4 expression in vivo upon LPS administration. Immunoblot and immunohistochemistry analysis of Klf4 expression in BALB/c mice brains upon LPS administration. (A) There are significant increases in Klf4 expression at different time points compared to control brain. (B) There is a significant increase in pNF-κB levels upon LPS administration in a time-dependent manner compared to control brain. The graphs represent pNF-κB and Klf4 protein levels in brains of LPS-treated mice relative to control mouse brain. *, **, Statistical differences in comparison to control values (* p < 0.05; ** p < 0.01). (C) Fluorescent microscopy images of Klf4 expression in microglial cells in brain cortices of control and LPS-treated mice. Klf4 (FITC, green) co-localizes with Iba1- (Alexa Fluor 594, red) positive microglial cells at 12 h and 48 h after LPS administration. Co-localization is shown by arrows in the merged images. Inset. The inset depicts high resolution confocal images of Klf4 and Iba1 co-localization (yellow) in single cells at the 12 h and 48 h time point. Data represent groups of 3 animals per treatment. Scale bar: 50 μm.
Figure 4
Figure 4
Role of Klf4 in mediating inflammation. Knockdown of Klf4 in BV-2 mouse microglial cells using SiRNA against Klf4 mRNA and subsequent decrease in the expression of pro-inflammatory cytokines. (A) q(RT)-PCR demonstrate a significant decrease in Klf4 mRNA levels in Si+LPS cells compared to LPS alone-treated cells. Cells treated with lipofectamine alone served as controls. The graph represents relative Klf4 mRNA expression values normalized to 18S rRNA internal control. (B) Immunoblot analysis of Klf4 protein isolated from BV-2 cells. Klf4 protein levels were decreased significantly in the Si+LPS group compared to LPS alone and to the Sc+LPS group. The graph represents Klf4 protein levels normalized to β-tubulin. No significant differences were observed in Si-alone and Sc-alone conditions compared to control cells for both mRNA and protein levels. (C-E) Cytokine bead array analysis of pro-inflammatory cytokines upon Klf4 knockdown. There is a more-than-two-fold decrease in TNF-α (C) and MCP-1 (D) levels in Klf4 knockdown samples, and a significant three-fold decrease is noticed in the case of IL-6 (E). *, **, Statistical differences in comparison to control values (* p < 0.05; ** p < 0.01) and #, Statistical differences with respect to LPS treated values, (# p < 0.01).
Figure 5
Figure 5
Role of Klf4 in iNOS expression upon LPS stimulation. (A) RT-PCR for iNOS mRNA demonstrates a significant decrease in iNOS mRNA levels upon Klf4 knockdown compared to LPS-treated cells. (B) Immunoblot showing iNOS levels under different conditions. There is a significant decrease in iNOS proteins levels in Si+LPS cells compared to LPS-treated cells. The graphs represent relative iNOS mRNA and protein levels with respect to the untreated controls. (C) Nitrite assay using Griess reagent was carried out to measure iNOS activity. A significant reduction is noticed in NO production as a result of Klf4 knockdown in LPS-treated samples. (D) Luciferase assay for iNOS promoter activity. Data is represented as relative luciferase units/amount of protein (in μg). A more-than-3-fold decrease is observed in luciferase activity in Si+LPS cells compared to LPS-treated cells. (E) EMSA carried out with nuclear extracts of control and LPS-treated BV-2 cells. Lane 1 shows free iNOS probe, whereas a shift is noticed in lane 2 when nuclear extracts were incubated with the probe. Lane 3 shows a supershift when Klf4-specific antibody was incubated with the probe and the nuclear extracts. The shift and supershift are indicated by arrows. Lane 4 shows a decreased shift when nuclear extracts from unstimulated control BV-2 cells were incubated with the iNOS probe. In lane 5, in addition to biotinylated probe, a 100-molar excess of unbiotinylated (Cold) probe was added along with nuclear extracts from LPS-stimulated cells. No significant band is observed in this lane. *, **, Statistical differences in comparison to control values and #, Statistical differences with respect to LPS-treated values respectively (* p < 0.05, ** p < 0.01, # p < 0.01).
Figure 6
Figure 6
Role of Klf4 in Cox-2 expression. (A) Semi-quantitative RT-PCR of Cox-2 mRNA indicates a significant decrease in Si+LPS cells compared to LPS-treated cells (B) Immunoblot for Cox-2 in total protein isolates from BV-2 cells. The protein levels of Cox-2 were also found to be significantly reduced within 12 h of LPS treatment in Si+LPS cells compared to LPS-treated cells. The graphs represent relative Cox-2 mRNA and protein levels with respect to the control samples. (C) Luciferase assay for Cox-2 promoter activity using a pCOX301/pGL2 construct. This construct has the luciferase gene directly regulated by Cox-2 promoter. There is a significant reduction in luciferase activity in the Si+LPS condition compared to the LPS-alone condition, indicating that Klf4 may be involved in regulating Cox-2 promoter activity. *, **, Statistical differences in comparison to control values and #, Statistical differences in comparison to LPS-treated values. (* p < 0.05, ** p < 0.01, # p < 0.01).
Figure 7
Figure 7
Klf4 interacts with pNF-κB during inflammation. (A) Immunoblot analysis of pNF-κB levels from total cellular extracts upon LPS treatment of BV-2 cells. The graph represents pNF-κB levels relative to untreated control sample at different time points. There is a significant increase in pNF-κB expression at all time points of LPS treatment compared to control. (B) Immunoblot and immunoprecipitation analysis of the interaction between pNF-κB and Klf4 in nuclear extracts of differently treated cells. Samples were 'pulled' down with a pNF-κB antibody. Lane A shows the blot for Klf4 in the upper panel and for pNF-κB in the lower panel in immunoprecipitate using anti-pNF-κB antibody, and lane B shows the same for immunoprecipitate using rabbit IgG as a control. *, **, Statistical differences in comparison to control values (* p < 0.05, ** p < 0.01).

Similar articles

Cited by

References

    1. Cerciat M, Unkila M, Garcia-Segura LM, Arevalo MA. Selective estrogen receptor modulators decrease the production of interleukin-6 and interferon-gamma-inducible protein-10 by astrocytes exposed to inflammatory challenge in vitro. Glia. 2010;58:93–102. doi: 10.1002/glia.20904. - DOI - PubMed
    1. Carson MJ, Thrash JC, Lo D. Analysis of microglial gene expression: identifying targets for CNS neurodegenerative and autoimmune disease. Am J Pharmacogenomics. 2004;4:321–30. doi: 10.2165/00129785-200404050-00005. - DOI - PubMed
    1. Kreutzberg GW. Microglia: a sensor for pathological events in the CNS. Trends Neurosci. 1996;19:312–8. doi: 10.1016/0166-2236(96)10049-7. - DOI - PubMed
    1. Beyer M, Gimsa U, Eyupoglu IY, Hailer NP, Nitsch R. Phagocytosis of neuronal or glial debris by microglial cells: upregulation of MHC class II expression and multinuclear giant cell formation in vitro. Glia. 2000;31:262–6. doi: 10.1002/1098-1136(200009)31:3<262::AID-GLIA70>3.0.CO;2-2. - DOI - PubMed
    1. Brown GC, Neher JJ. Inflammatory Neurodegeneration and Mechanisms of Microglial Killing of Neurons. Mol Neurobiol. 2010;41(2-3):242–7. doi: 10.1007/s12035-010-8105-9. - DOI - PubMed

Publication types

MeSH terms