. 2009:469:353-72.
doi: 10.1016/S0076-6879(09)69017-0. Epub 2009 Nov 17.

Laser-induced temperature jump infrared measurements of RNA folding

Affiliations

Laser-induced temperature jump infrared measurements of RNA folding

R Brian Dyer et al. Methods Enzymol. 2009.

Abstract

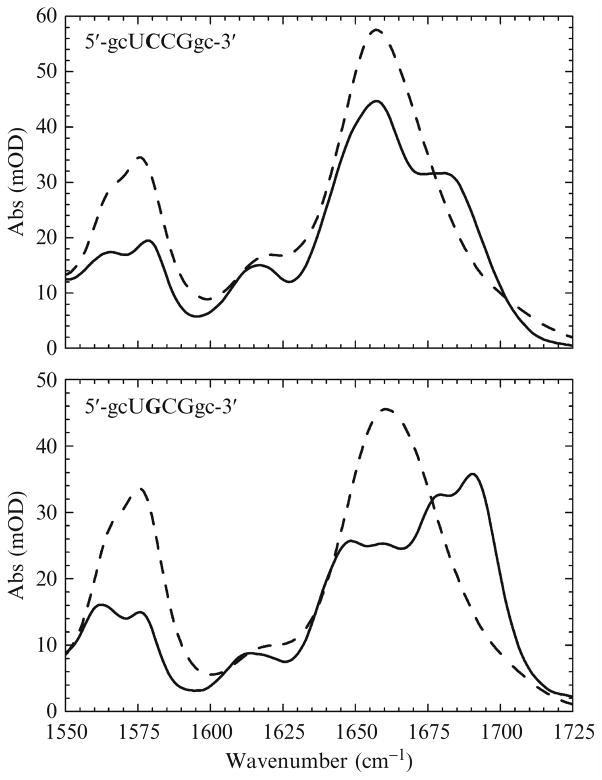
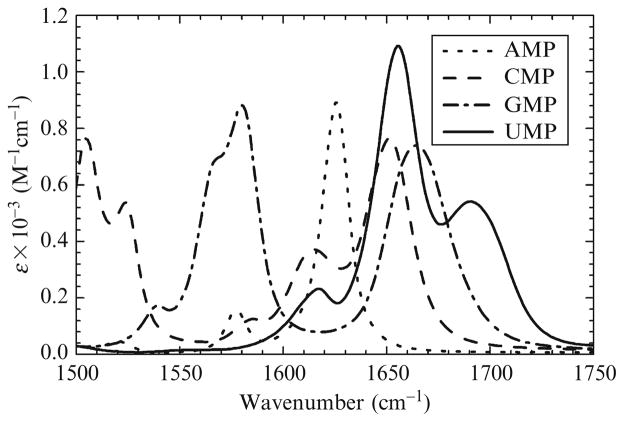
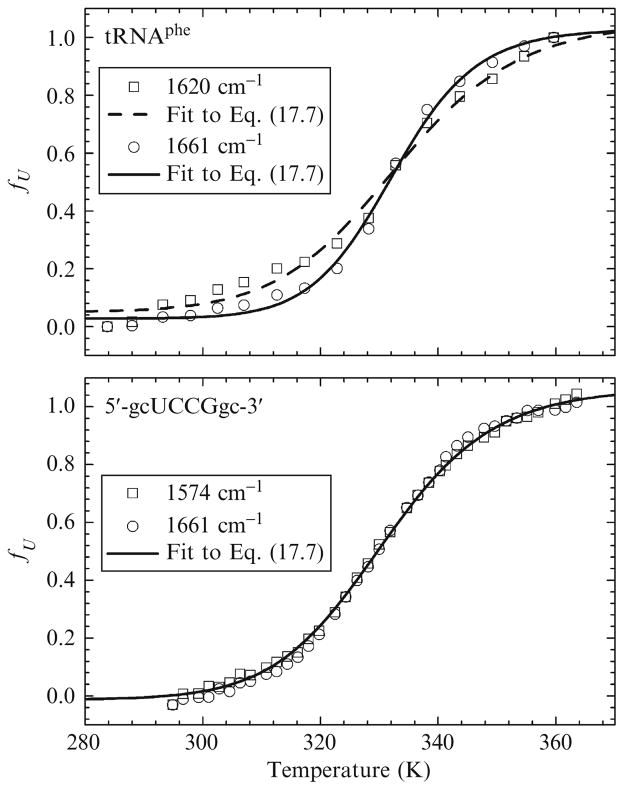
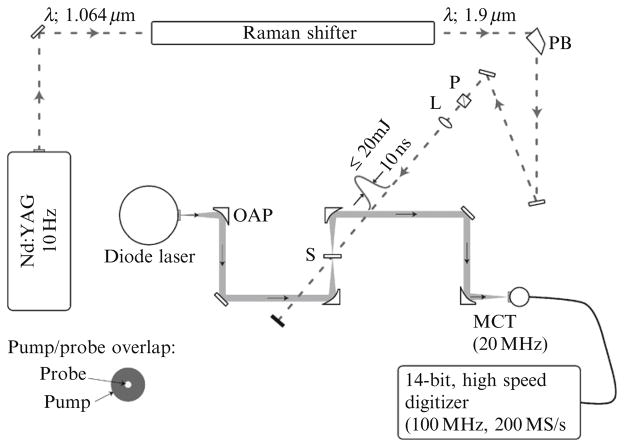
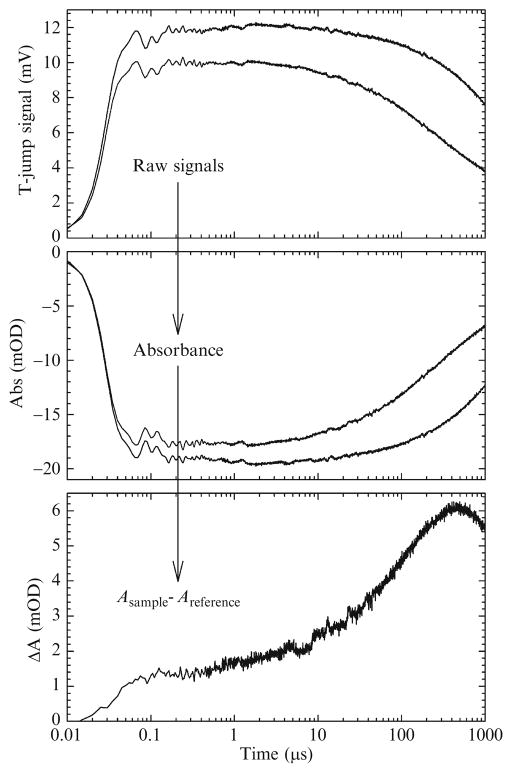
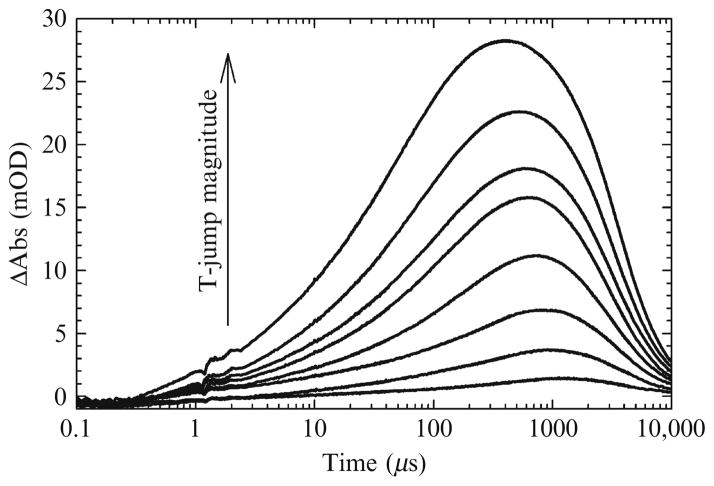
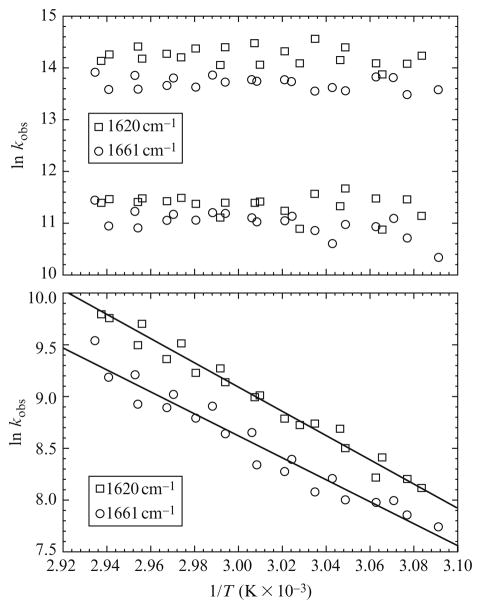
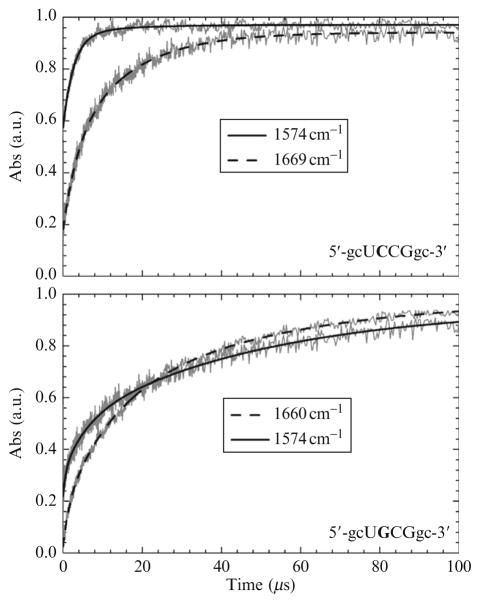
Probing a sample using infrared spectroscopy following a laser-induced temperature jump is a powerful method to monitor fast relaxation kinetics. Here, we describe how this approach is used to study the kinetics of RNA folding. We begin with a concise summary of the infrared spectral properties of RNA in the 1500-1800cm(-1) region. The infrared transitions in this region are directly related to the double bond stretching vibrations and ring modes of the nucleotide bases. When RNA undergoes a conformational change, the local environments of the nucleotides are altered. Consequently, the changes in the corresponding infrared spectrum are associated with the structural changes. Experimentally, temperature is used to systematically vary the RNA structure. When a short laser pulse is used to produce a rapid temperature increase in the sample, the structural changes that ensue can be followed in real time. In this contribution, we discuss experimental methods including sample preparation, instrumentation, and data analysis. We conclude with several experimental examples that highlight usefulness of the technique.


Figures

Figure 17.1
Figure 17.1
Equilibrium FTIR spectra of two RNA tetraloops. The sequences are indicated in the figures. Bases written in uppercase are the unpaired bases found in the loop while those written in lowercase are the bases found in the stem. The dashed lines are spectra of the unfolded RNA and the solid lines are the folded spectra. Note the similarities between the two unfolded spectra and the differences between the folded spectra.
Figure 17.2
Figure 17.2
Equilibrium FTIR spectra of the four nucleotide bases. Band assignments are given in the text.
Figure 17.3
Figure 17.3
Melt curves for the indicated RNAs. All data have been normalized by converting them to the fraction unfolded fU using Eq. (17.3).
Figure 17.4
Figure 17.4
Schematic of the T-jump spectrometer described in the text. OAP, off-axis parabolic mirror; PB, Pellin–Broca prism; P, polarizer; L, lens; S, sample; MCT, mercury cadmium telluride detector. The size of the pump relative to the probe at the point of overlap is shown in the lower left corner.
Figure 17.5
Figure 17.5
Example of kinetic data. The digitized MCT signals (top; gray is the sample and black is the reference) are converted to absorbance (middle) then the reference absorbance is subtracted from the sample absorbance (bottom).
Figure 17.6
Figure 17.6
A series of transient absorptions recorded at 1661 cm−1 for tRNAphe. Qualitatively, the data at 1620 cm−1 are the same. The initial temperature was held constant at 47 °C and the magnitude of the T-jump was varied up to a maximum of 20 °C. Each transient was fit to a three exponential model from t = 100 ns to the maximum transient absorption (t = ~ 1 ms).
Figure 17.7
Figure 17.7
Arrhenius plots of the tRNA T-jump data at 1620 cm−1 (squares) and 1661 cm−1 (circles). The upper plot shows the fast and intermediate phases. These correspond to nonactivated processes. The lower plot shows the slow phase. In addition to corresponding to an activated process, the kinetics at 1620 cm−1 is faster than those at 1661 cm−1.
Figure 17.8
Figure 17.8
Transient absorption profiles for the indicated oligonucleotides. The absorbance has been normalized to facilitate direct qualitative comparison.

References

    1. Ansari A, Kuznetsov SV, Shen Y. Configurational diffusion down a folding funnel describes the dynamics of DNA hairpins. Proc Natl Acad Sci USA. 2001;98:7771–7776. - PMC - PubMed
    1. Ballin JD, Bharill S, Fialcowitz-White EJ, Gryczynski I, Gryczynski Z, Wilson GM. Site-specific variations in RNA folding thermodynamics visualized by 2-aminopurine fluorescence. Biochemistry. 2007;46:13948–13960. - PMC - PubMed
    1. Banyay M, Sarkar M, Gräslund A. A library of IR bands of nucleic acids in solution. Biophys Chem. 2003;104:477–488. - PubMed
    1. Bernasconi CF. Relaxation Kinetics. Academic Press; New York: 1976.
    1. Brauns EB, Dyer RB. Time-resolved infrared spectroscopy of RNA folding. Biophys J. 2005;89:3523–3530. - PMC - PubMed

LinkOut - more resources