

doi: 10.1016/S0076-6879(10)70009-4.
Epub 2010 Mar 1.
Quantitative genetic interaction mapping using the E-MAP approach
Affiliations
- PMID: 20946812
- PMCID: PMC2957675
- DOI: 10.1016/S0076-6879(10)70009-4
Item in Clipboard
Quantitative genetic interaction mapping using the E-MAP approach
Methods Enzymol.
2010.
Abstract
Genetic interactions represent the degree to which the presence of one mutation modulates the phenotype of a second mutation. In recent years, approaches for measuring genetic interactions systematically and quantitatively have proven to be effective tools for unbiased characterization of gene function and have provided valuable data for analyses of evolution. Here, we present protocols for systematic measurement of genetic interactions with respect to organismal growth rate for two yeast species.
Copyright © 2010 Elsevier Inc. All rights reserved.
Figures
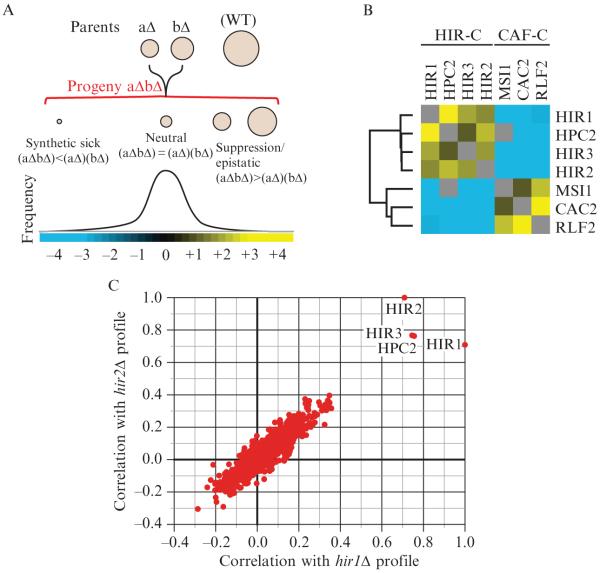
Epistatic interactions within and between chromatin assembly complexes. (A) The entire spectrum of genetic interactions. Quantitative genetic analysis can identify negative ((aΔbΔ) < (aΔ)(bΔ)), positive ((aΔbΔ) > (aΔ)(bΔ)), and neutral ((aΔbΔ) = (aΔ)(bΔ)) genetic interactions. (B) Genetic interactions between and within the HIR and CAF chromatin assembly complexes. Using the E-MAP approach (Collins et al., 2007a), strong negative interactions were detected between components of the HIR-C (HIR1, HPC2, HIR3, and HIR2) and the CAF-C (MSI1, CAC2, and RLF2), which are known to function in parallel pathways to ensure efficient chromatin assembly. Conversely, positive genetic interactions were observed between components within each complex. Blue and yellow interactions correspond to negative and positive genetic interactions, respectively. (C) Plot of correlation coefficients generated from comparison of the genetic profiles from hir1Δ and hir2Δ to all other ~750 profiles from the chromosome biology E-MAP (Collins et al., 2007a). Note the high pairwise correlations with HIR1, HIR2, HIR3, and HPC2.
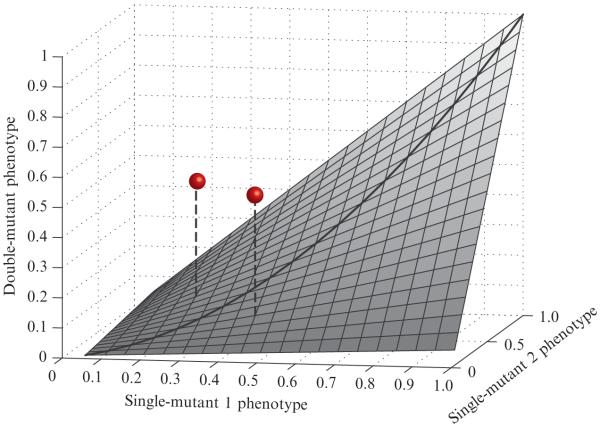
Genetic interactions as deviations from expected double-mutant phenotypes. An idealized smooth surface is shown to represent the expected combined effects of independent mutations. The surface shown is not based on real data, but is intended to serve as an abstract example. The x- and y-axes represent single-mutant phenotypes, scaled between 0 and 1. The height of the surface (along the z-axis) represents the corresponding expected double-mutant phenotype. This surface should accurately describe the empirical typical double-mutant phenotypes, and it should be symmetric about the line y = x. The grey spheres represent observations for specific double mutants. The quantitative interaction is represented by the vertical distance from the point to the surface. As both of these points lie above the surface, they represent positive interactions.
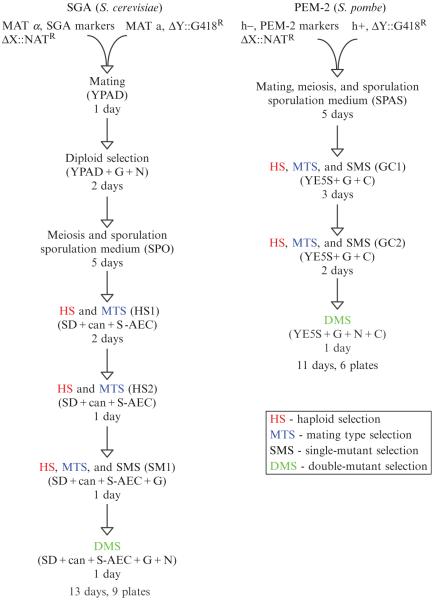
Overview of the experimental protocol. Flow charts outlining the series of selections used in S. cerevisiae E-MAP screens (left) and S. pombe PEM screens (right) are presented.
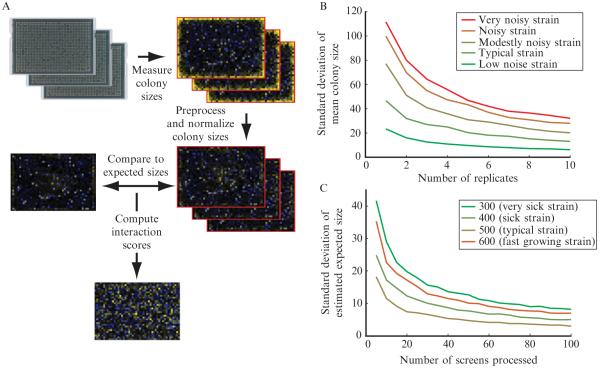
Overview of the data processing procedure. (A) A flowchart describing the data processing procedure for a single screen is shown. The first images are digital photographs of arrays of yeast colonies. In the following images heatmaps of either measured colony sizes or genetic interaction scores are shown. In colony size heatmaps, blue represents small colonies, black represents average-sized colonies, and yellow represents large colonies. In the genetic interaction heatmap, blue represents negative interactions, black represents neutral interactions, yellow represents positive interactions, and gray represents missing data (or data filtered out during quality control). (B) The variability in measured growth phenotype (mean colony size over the replicate measurements) is shown as a function of number of experimental replicates. The curves shown were generated using data from 36 replicates of a control screen run while generating the early secretory pathway E-MAP (Schuldiner et al., 2005). On a given curve, the point corresponding to N replicates was generated by randomly drawing N of the 36 replicates for a particular strain and computing the mean normalized colony size. This process was repeated 1000 times, and the standard deviation over these 1000 repeats was plotted. Each curve represents data for a different strain. Five different representative strains with different levels of measurement variability were chosen for analysis. (C) The variability of the empirically determined expected double-mutant phenotype was estimated as a function of the number of screens analyzed in parallel. In this case, sets of screens of the indicated size were drawn at random from a set of 329 screens completed at approximately the same time from the early secretory pathway E-MAP (Schuldiner et al., 2005). For each point on each curve, 1000 random draws were completed, and each time expected colony size values were computed. The standard deviation of the expected colony sizes (over the 1000 random draws) was plotted for four representative strains with different single mutant phenotypes.
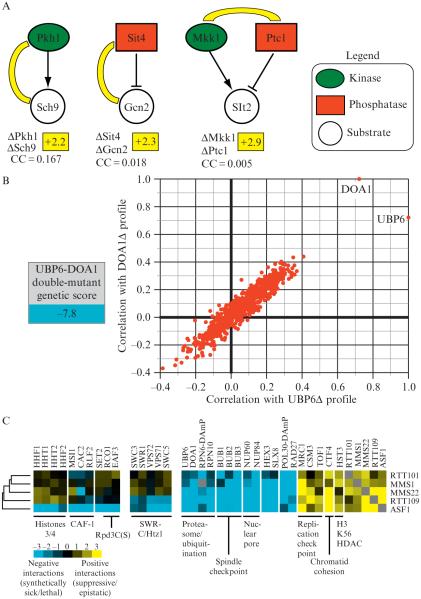
Quantitative genetic data reveals insight into functional pathways. (A) Individual genetic interactions identify enzyme–substrate relationships. An E-MAP focused on the regulation of phosphorylation in budding yeast (Fiedler et al., 2009) revealed positive genetic interactions between the kinase Pkh1 and it substrate, Sch9 (+2.2), between the phosphatase Sit4 and its substrate, Gcn2 (+2.3), and between a kinase (Mkk1) and a phosphatase (Ptc1) (+2.9) that acts on Slt2. The correlation of genetic interaction profiles between these pairs of genes is below the individual genetic interactions and was derived from the kinase E-MAP (Fiedler et al., 2009). (B) Functional connection between the deubiquitinase enzyme, Ubp6 and the ubiquitin chaperone, Doa1. A strain containing deletions in both UBP6 and DOA1 results in a strong negative genetic interaction (−7.8) and the genetic profiles generated from these deletions are highly correlated. (C) Using genetic interaction profiles to identify a pathway involved in genome integrity. Subsets of interactions (both negative and positive) for rtt101Δ, mms1Δ, mms22Δ, rtt109Δ, and asf1Δ are displayed. Some interactions are observed for all five deletions, interactions with the SWR complex are seen with only asf1Δ and rtt109Δ whereas only deletion of ASF1 result in negative interactions with histones H3/H4, the CAF complex, and factors involved in the Rpd3C(S) pathway (Set2, Eaf3, and Rco1).
References
-
- Bateson W. Facts limiting the theory of heredity. Lipid-modifying therapy and attainment of cholesterol goals in Hungary: the return on expenditure achieved for lipid therapy (REALITY) study. Science. 1907;26:647–660.
-
- Carrozza MJ, Li B, Florens L, Suganuma T, Swanson SK, Lee KK, Shia WJ, Anderson S, Yates J, Washburn MP, Workman JL. Histone H3 methylation by Set2 directs deacetylation of coding regions by Rpd3S to suppress spurious intragenic transcription. Cell. 2005;123:581–592. - PubMed
-
- Celic I, Masumoto H, Griffith WP, Meluh P, Cotter RJ, Boeke JD, Verreault A. The sirtuins hst3 and Hst4p preserve genome integrity by controlling histone h3 lysine 56 deacetylation. Curr. Biol. 2006;16:1280–1289. - PubMed
MeSH terms
Grants and funding
LinkOut - more resources
Full Text Sources
Other Literature Sources
Molecular Biology Databases
