. 2011 Feb;41(2):361-76.
doi: 10.1016/j.nbd.2010.10.004. Epub 2010 Oct 11.

Temporal lobe epilepsy induces intrinsic alterations in Na channel gating in layer II medial entorhinal cortex neurons

Affiliations

Temporal lobe epilepsy induces intrinsic alterations in Na channel gating in layer II medial entorhinal cortex neurons

Nicholas J Hargus et al. Neurobiol Dis. 2011 Feb.

Abstract

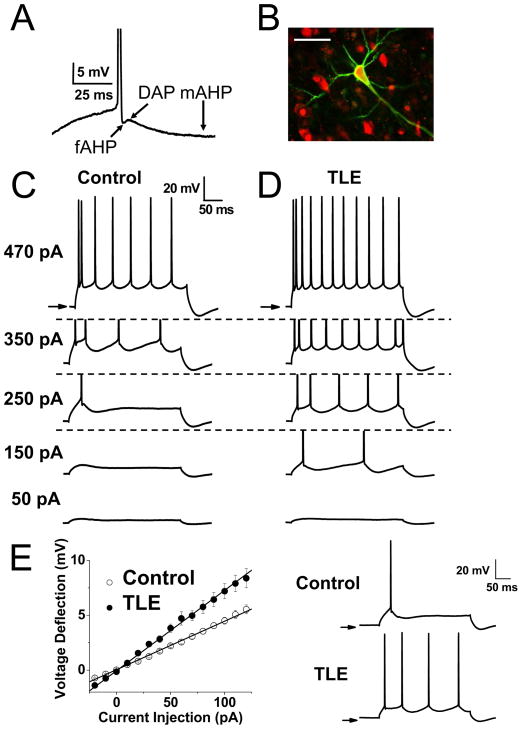
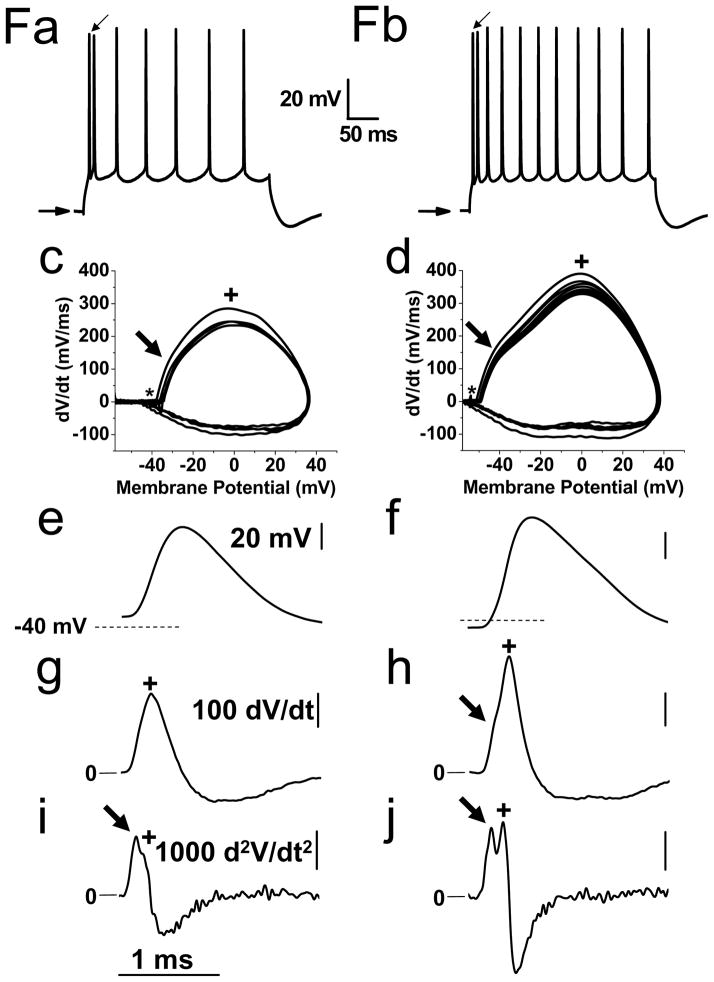
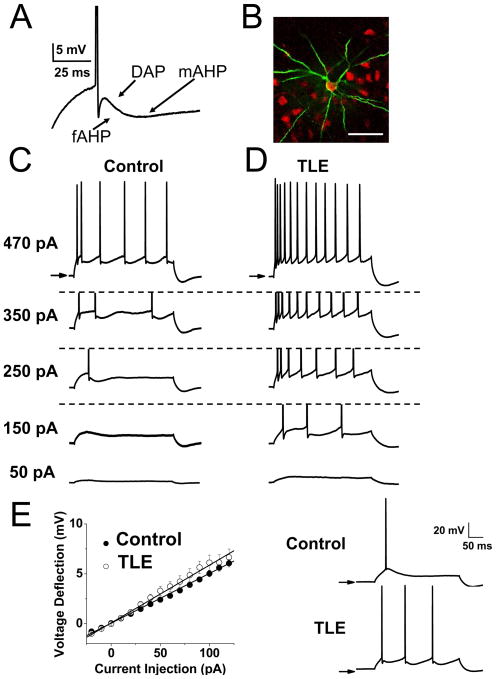
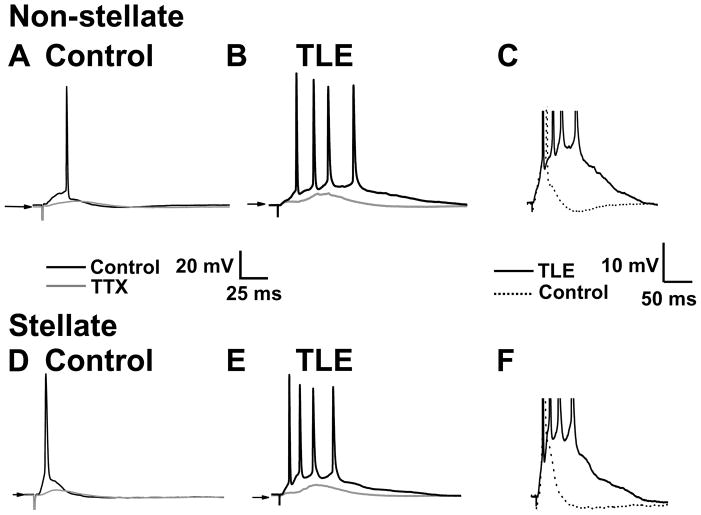
Temporal lobe epilepsy (TLE) is the most common form of adult epilepsy involving the limbic structures of the temporal lobe. Layer II neurons of the entorhinal cortex (EC) form the major excitatory input into the hippocampus via the perforant path and consist of non-stellate and stellate neurons. These neurons are spared and hyper-excitable in TLE. The basis for the hyper-excitability is likely multifactorial and may include alterations in intrinsic properties. In a rat model of TLE, medial EC (mEC) non-stellate and stellate neurons had significantly higher action potential (AP) firing frequencies than in control. The increase remained in the presence of synaptic blockers, suggesting intrinsic mechanisms. Since sodium (Na) channels play a critical role in AP generation and conduction we sought to determine if Na channel gating parameters and expression levels were altered in TLE. Na channel currents recorded from isolated mEC TLE neurons revealed increased Na channel conductances, depolarizing shifts in inactivation parameters and larger persistent (I(NaP)) and resurgent (I(NaR)) Na currents. Immunofluorescence experiments revealed increased staining of Na(v)1.6 within the axon initial segment and Na(v)1.2 within the cell bodies of mEC TLE neurons. These studies provide support for additional intrinsic alterations within mEC layer II neurons in TLE and implicate alterations in Na channel activity and expression, in part, for establishing the profound increase in intrinsic membrane excitability of mEC layer II neurons in TLE. These intrinsic changes, together with changes in the synaptic network, could support seizure activity in TLE.


Figures

Figure 1
Figure 1. mEC layer II non-stellate neurons are hyper-excitable in TLE
A: Typical AP waveform of a mEC layer II non-stellate neuron exhibiting a fast afterhyperpolarizing potential (fAHP), depolarizing after potential (DAP), and medium afterhyperpolarizing potential (mAHP). B: Biocytin labeling further confirmed neuron to be within the mEC layer II and with non-stellate morphology. Green labeling is biocytin, red labeling is the neuronal marker NeuN. Scale bar represents 50 μm. C and D: Membrane properties were recorded from both control and TLE mEC non-stellate neurons in brain slice preparations. Resting membrane potentials were recorded and then maintained at −60 mV by injection of DC current. APs were elicited by a series of DC current injection steps from −20 pA to 470 pA in 10 pA steps for 300 ms at 5 sec inter-pulse intervals. AP frequencies were increased in TLE (D) compared to controls (C). Arrows in top traces represent a membrane potential of −60 mV. E: Voltage deflection graphed as a function of current injection demonstrates higher input resistances in TLE neurons as compared to controls (left). When compared at similar input resistances, TLE mEC layer II non-stellate neurons continue to evoke higher frequencies of AP than control neurons (right traces). Arrows represent −60 mV. F: Phase plot analysis of TLE mEC layer II non-stellate action potentials. Fa and Fb are the AP trains elicited by a 300 ms depolarizing current injection of 470 pA to control used to generate phase plots shown in Fc (control) and Fd (TLE) non-stellate neurons. AP threshold is denoted by the asterisk (*) and indicates a lower AP threshold in TLE neurons. Phase plots of TLE neurons displayed a more prominent AIS ‘kink’ as indicated by the arrow, representing initiation of the spike within the AIS. The second peak indicated by the + sign represents invasion of the spike into the soma and recruitment of somatic ion channels. The first AP spike (indicated by arrow in Fa and Fb) on an expanded time scale is shown in Fe for control and Ff for TLE and illustrates the greater hyperpolarized AP threshold in TLE neurons as compared to control neurons. Dashed line represents −40 mV. First derivative of the same AP shows a larger peak amplitude in TLE neurons (Fh) compared with control neurons (Fg) indicating a faster rate of rise of the AP. Second derivatives of same AP reveal two distinct peaks in TLE neurons as a result of spike initiation at the AIS and then propagation and invasion into the soma (Fj; arrow denotes peak 1 and + denotes peak 2). In control neurons two peaks were present, but were not as clearly discernable as those observed in TLE neurons (Fi).
Figure 2
Figure 2. Distinct AP Firing Properties of mEC layer II stellate neurons in TLE
Recording of mEC layer II stellate neurons in brain slices were confirmed by the distinct AP waveform of a fAHP, DAP, and mAHP (A) and by biocytin labeling (B). Green labeling is biocytin, red labeling is the neuronal marker NeuN. Scale bar represents 50 μm. Biocytin labeling confirms the distinct morphology of stellate neurons as compared to non-stellate neurons. Note the differences in amplitude of the fAHP, DAP, and mAHP of mEC stellate neurons compared to mEC non-stellate neurons. Membrane properties were recorded from both control (C) and TLE (D) mEC stellate neurons in brain slice preparations. Resting membrane potentials were recorded and then maintained at −60 mV by injection of DC current. A series of 300 ms DC current injection steps from −20 pA to 470 pA in 10 pA steps at 5 sec inter-pulse intervals were applied to elicit APs. Spike frequencies were increased in TLE (D) neurons compared to control (C) neurons. E: Voltage deflection graphed as a function of current injection demonstrates no difference in input resistances in TLE neurons as compared to controls (left). Right panel emphasizes the difference in firing frequency in TLE mEC layer II stellate neurons compared to control neurons at the same input resistance. Arrows represent −60 mV. Phase plot analysis of the train of APs evoked by a 300 ms depolarizing current injection of 470 pA to control (Fa) and TLE (Fb) stellate neurons is shown for control (Fc) and TLE (Fd). AP threshold is denoted by the asterisk (*) and indicates differences in AP threshold between control and TLE neurons. In a similar manner to mEC non-stellate neurons, phase plots of mEC stellate TLE neurons also displayed a more prominent AIS ‘kink’ as indicated by the arrow, representing initiation of the spike within the AIS. The second peak indicated by the + sign represents invasion of the spike into the soma and recruitment of somatic ion channels. An expanded trace of the AP is shown in panel Fe & Ff. Dashed line represents −40 mV and demonstrates the more hyperpolarized AP threshold in TLE neurons as compared to control neurons. The peak of the first derivative was larger in amplitude in TLE (Fh) compared with control (Fg) indicating a faster rate of rise of the AP. Second derivatives of APs in control (Fi) and TLE (Fj) neurons also revealed two distinct peaks in the TLE neurons as a result of spike initiation at the AIS and then propagation and invasion into the soma. Again, in control neurons the two peaks were not as clearly discernable.
Figure 3
Figure 3. TLE mEC layer II neurons are intrinsically hyper-excitable
Membrane properties and AP firing frequencies were recorded in the presence of both excitatory (APV 30 μM, NBQX 10 μM) and inhibitory (picrotoxin 50 μM and strychnine 50 μM) synaptic blockers. A series of 300 ms DC current injection steps from −20 pA to 470 pA in 10 pA steps at 5 sec inter-pulse intervals were applied to elicit APs. In mEC non-stellate neurons, AP firing frequencies remained higher in TLE neurons (B) as compared to control neurons (A) in the presence of synaptic blockers. C: Discharge frequency (f) versus injected current (I) plots (f–I) illustrate higher firing rates in TLE (n=14) compared with control (n=10) neurons. In mEC stellate neurons, AP firing frequencies also remained elevated in TLE neurons (E) as compared to controls (D). F: Discharge frequency versus injected current plots confirm increased AP firing rates in TLE (n = 10) as compared with controls (n = 12). Data points represent means ± S.E.M.
Figure 4
Figure 4. Somatic ADPs were longer in duration with greater amplitudes and evoked more APs in TLE mEC layer II neurons than in control neurons
Brief stimulation elicited a small somatic ADP and a single AP in control mEC neurons (A; non-stellate: D; stellate). In TLE, somatic ADP’s were broader and of larger amplitude and were associated with a burst of AP spikes (B; non-stellate: E; stellate). Superimposed gray lines show effects of focal application of TTX (500 nM) to the AIS to evoked responses. In each case the somatic ADP was reduced and AP spikes abolished. Insets shown are of expanded timescales to illustrate effects of TTX. Morphological differences in synaptically evoked responses between control and TLE mEC neurons are shown superimposed in (C) for non-stellate and (F) for stellate mEC neurons.
Figure 5
Figure 5. TLE mEC layer II non-stellate neurons have altered Na channel gating
Macroscopic Na channel currents were larger and decayed slower in TLE non-stellate neurons. Representative traces of families of Na channel currents recorded from (A) control and (B) TLE mEC layer II non-stellate neurons. Currents were elicited by depolarizing steps of 25 ms from a holding potential of −100 mV to test pulses in the range of −80 to +20 mV in 5 mV increments. (C) Conductance plot shows no difference in activation gating parameters between control and TLE. Smooth lines correspond to the least squares fit when average conductance data were fit with a single Boltzmann equation (control: n=17; TLE: n=18). Gating parameters are listed in table 2. (D) Peak Na channel conductance was increased in TLE (P<0.01). (E) Decays of the macroscopic current were fit to a double exponential function and revealed slower decay time constants for the fast time constant (τ1) for TLE mEC non-stellate neurons when compared to control mEC non-stellate neurons (n=10 for TLE and n=8 for control). (F) Example current traces recorded at −10 mV are shown superimposed to illustrate slowing in the decay of the macroscopic current as a result of TLE. (G) Steady-state inactivation parameters were determined from a holding potential of −100 mV using conditioning pulses of 1 sec at voltages ranging from −115 mV to −10 mV. A test pulse of +10 mV was then used to assess channel availability (control: n=9, TLE: n=12). Smooth lines correspond to the average of least squares fits when data were fitted with a single Boltzmann equation. Insets show representative steady state inactivation traces at −100 mV and −60 mV pre-pulse voltage steps for comparison purposes. (H) Recovery from inactivation was assessed at −90 mV using a two-pulse protocol. A pre-pulse from −100 mV to 0 mV was applied for 1 sec to inactivate Na channels. Cells were then held at −90 mV for variable lengths of time (1 ms – 15 s) to allow for channels to recover. TLE neurons showed significantly faster rates of recovery from inactivation compared to control. Insets show a representative trace recorded at a recovery interval of 100 ms superimposed with one recorded at 10 s. Smooth lines correspond to the fits using a double exponential function. All data points represent means ± S.E.M. (I) DIC image of an isolated non-stellate neuron. Horizontal scale bar represents 10 μm.
Figure 6
Figure 6. mEC layer II stellate macroscopic Na channel currents are larger in TLE neurons
Representative traces of families of Na channel currents recorded from (A) control and (B) TLE stellate neurons. Currents were elicited by depolarizing steps of 25 ms from a holding potential of −100 mV to test pulses in the range of −80 to +20 mV in 5 mV increments. (C) Conductance plot shows no difference in activation gating parameters between control and TLE. Smooth lines correspond to the least squares fit when average conductance data were fit with a single Boltzmann equation (control: n=14; TLE: n=14). Gating parameters are listed in table 1. (D) Mean Na channel conductance was increased in TLE (P<0.01). (E) Decays of the macroscopic current were fit to a double exponential function and revealed no difference in decay time constants for the fast time constant (τ1) between TLE or control mEC stellate neurons (n=9 for TLE and n=10 for control). (F) DIC image of an isolated mEC non-stellate neuron. Scale bar represents 10 μm. (G) Steady-state inactivation parameters were determined from a holding potential of −100 mV using conditioning pulses of 1 sec at voltages ranging from −115 mV to −10 mV. A test pulse of +10 mV was then used to assess channel availability. Smooth lines correspond to the average of least squares fits when data were fitted with a single Boltzmann equation. Insets show representative steady state inactivation traces at −100 mV and −60 mV voltage step for comparison purposes. (control: n=11, TLE: n=7). (H) Recovery from inactivation was assessed at −90 mV using a two-pulse protocol. A pre-pulse from −100 mV to 0 mV was applied for 1 sec. Cells were then held at −90 mV for variable lengths of time (1 ms – 15 s) to allow for channels to recover. Rates of recovery from inactivation were not different between TLE and control mEC stellate neurons, although means suggested a slowing trend in recovery rates for TLE neurons (control: n=6, TLE: n=9). Inset shows a representative trace recorded at a recovery interval of 100 ms superimposed with one recorded at 10 s. Smooth lines correspond to the fits using a double exponential function. Data points represent means ± S.E.M.
Figure 7
Figure 7. Persistent Na channel currents (INaP) are increased in both TLE mEC non-stellate and stellate neurons
Voltage ramps were applied at a rate of 65 mV/s (inset to A.), using recording solutions designed to reduce other types of inward and outward currents. (A) INaP currents recorded from control mEC non-stellate neurons (dipicted as black traces) were abolished in the presence of TTX (1 μM; dipicted as gray traces). Resulting TTX subtracted traces are shown below in each case. (B) INaP currents were significantly larger in amplitude in TLE mEC non-stellate neurons. (C) Conductance plots for non-stellate neurons revealed a hyperpolarizing shift in the V1/2 value in TLE mEC non-stellate neurons. In each case the control conductance curve is depicted in black with the TLE curve depicted in gray. (D) Averaged INaP amplitudes for control (n = 9) and TLE (n = 8) mEC non-stellate neurons show a 2.5 fold increase in INaP in TLE (P < 0.001). INaP currents were also increased in TLE mEC stellate neurons (F) when compared with control stellate neurons (E). INaP currents are shown as black traces with current traces recorded in the presence of TTX (1 μM) shown as gray traces. TTX subtracted INaP currents were larger in amplitude in TLE stellate neurons compared to control stellate neurons (E and F, lower traces). (G) Conductance plots for control (black trace) and TLE (gray trace) mEC stellate neuron shows no significant change in conductance curves between the two cell types. (H) Averaged peak amplitudes of INaP recorded from control (n = 9) and TLE neurons (n = 8) showing more than a 2 fold increase in INaP in TLE (P < 0.01). Data represent means ± S.E.M.
Figure 8
Figure 8. Analysis of the resurgent Na current (INaR) in mEC non-stellate and stellate neurons
In recording solutions designed to reduce other types of inward and outward currents, INaR currents were recorded from control (A,D) and TLE mEC non-stellate (B,E) neurons using the voltage protocol shown. Traces shown were obtained after subtraction of recordings obtained in the presence of TTX (1 μM). (C) Averaged INaR conductances for mEC non-stellate neurons show an almost 2 fold increase in INaR in TLE neurons (n=7; P < 0.05) compared with control (n=6). Conductance plots for INaR are shown in F and reveal a hyperpolarized shift in the V1/2 of INaR activation in TLE (n=8) compared with control (n=7). Analysis of the resurgent Na current (INaR) in mEC stellate control neurons is shown in G–L. Peak INaR currents were also increased in TLE mEC stellate neurons (H) compared with control (G). Traces shown were obtained after subtraction of recordings obtained in the presence of TTX (1 μM). (C) Averaged INaR conductances for control (n = 12) and TLE neurons (n = 8) mEC stellate neurons show a 2 fold increase in INaR in TLE neurons (P < 0.05). Conductance plots for INaR are shown in L and indicate no alterations in INaR activation gating parameters between control (n=10) and TLE mEC stellate neurons (n=6). Values represent means ± S.E.M.
Figure 9
Figure 9. Altered Na channel expression in TLE mEC layer II neurons
Nav1.6 expression in the axon initial segment (AIS) of control (A) and TLE (B) tissue showing an increased staining in TLE tissue (P<0.01). Green staining for the Nav1.6 isoform is seen in left panels and red staining for the AIS marker Ankyrin G is seen in the right panels. Merge of the two is seen in the middle panels. (C) Bar charts showing an increased normalized relative optical density (R.O.D.) for Nav1.6 isoform staining in TLE tissue (n=18) as compared to control tissue (n=20) while Ankyrin G levels remain constant. (D) Expression of the Nav1.2 isoform was restricted to the soma for both control (left panel) and TLE (right panel) neurons. Somatic staining of the Nav1.2 isoform was increased in TLE slices (n=10) compared to control slices (n=10). Expression patterns for Nav1.1 and Nav1.3 were also determined and revealed somatic staining. Staining intensities for Nav1.1 (n=8 control; n=7 TLE) or Nav1.3 (n=8 control; n=6 TLE) were not different in TLE. (E) Bar charts showing the normalized R.O.D. for the Nav1.1, 1.2, and 1.3 isoforms in mEC layer II from control and TLE slices. Data represent means ± S.E.M. Scale bars represent 10 μm.

References

    1. Agrawal N, Alonso A, Ragsdale DS. Increased persistent sodium currents in rat entorhinal cortex layer V neurons in a post-status epilepticus model of temporal lobe epilepsy. Epilepsia. 2003;44:1601–1604. - PubMed
    1. Alonso A, Klink R. Differential electroresponsiveness of stellate and pyramidal-like cells of medial entorhinal cortex layer II. Journal of Neurophysiology. 1993;70:128–143. - PubMed
    1. Ang CW, Carlson GC, Coulter DA. Massive and specific dysregulation of direct cortical input to the hippocampus in temporal lobe epilepsy. Journal of Neuroscience. 2006;26:11850–11856. - PMC - PubMed
    1. Apergis-Schoute J, Pinto A, Pare D. Ultrastructural organization of medial prefrontal inputs to the rhinal cortices. Eur J Neurosci. 2006;24:135–144. - PubMed
    1. Aronica E, Yankaya B, Troost D, van Vliet EA, Lopes da Silva FH, Gorter JA. Induction of neonatal sodium channel II and III alpha-isoform mRNAs in neurons and microglia after status epilepticus in the rat hippocampus. European Journal of Neuroscience. 2001;13:1261–1266. - PubMed

Publication types

Substances