. 2010 Oct 19;56(17):1386-94.
doi: 10.1016/j.jacc.2010.03.098.

Optical mapping of the isolated coronary-perfused human sinus node

Affiliations

Optical mapping of the isolated coronary-perfused human sinus node

Vadim V Fedorov et al. J Am Coll Cardiol. .

Abstract

Objectives: We sought to confirm our hypothesis that the human sinoatrial node (SAN) is functionally insulated from the surrounding atrial myocardium except for several exit pathways that electrically bridge the nodal tissue and atrial myocardium.

Background: The site of origin and pattern of excitation within the human SAN has not been directly mapped.

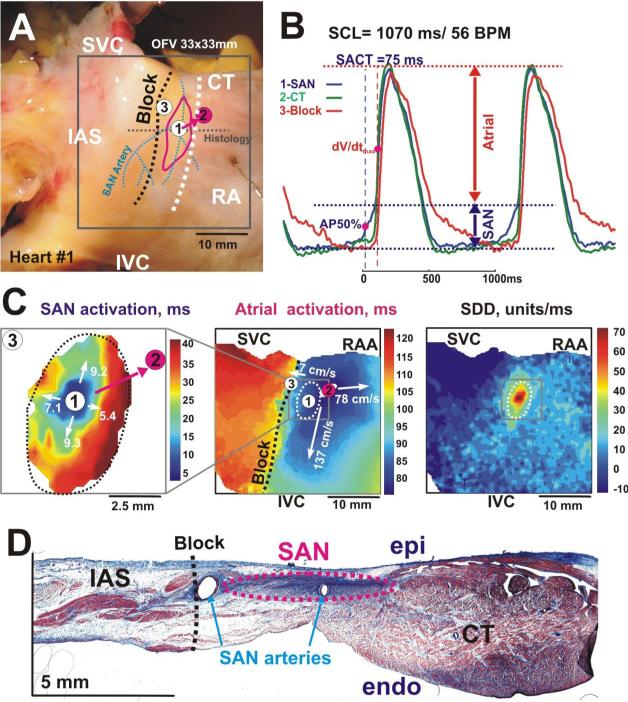
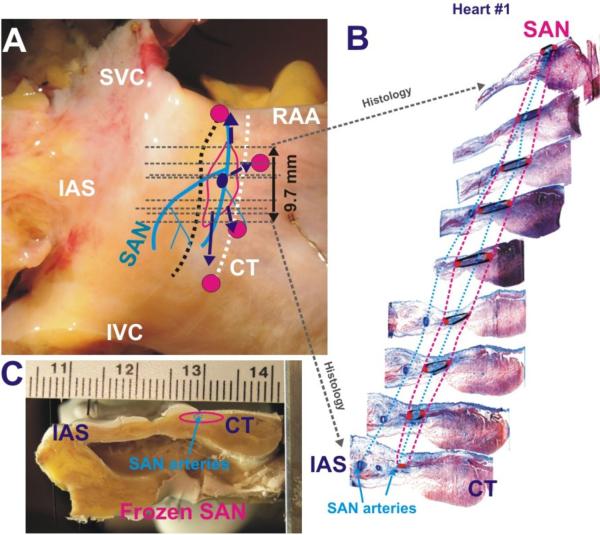
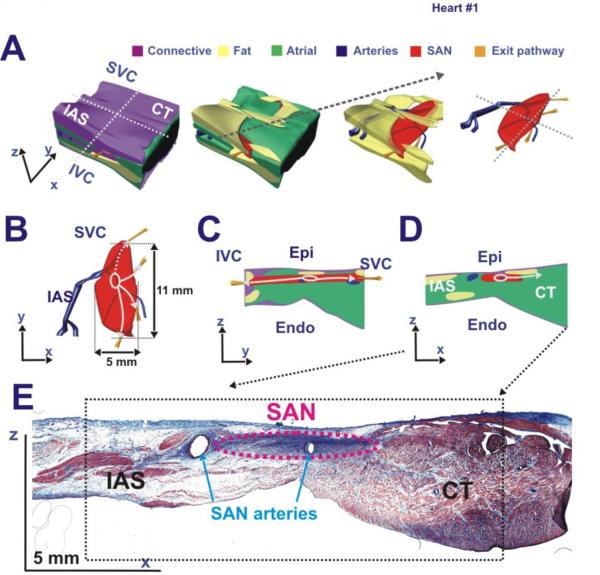
Methods: The SAN was optically mapped in coronary-perfused preparations from nonfailing human hearts (n = 4, age 54 ± 15 years) using the dye Di-4-ANBDQBS and blebbistatin. The SAN 3-dimensional structure was reconstructed using histology.

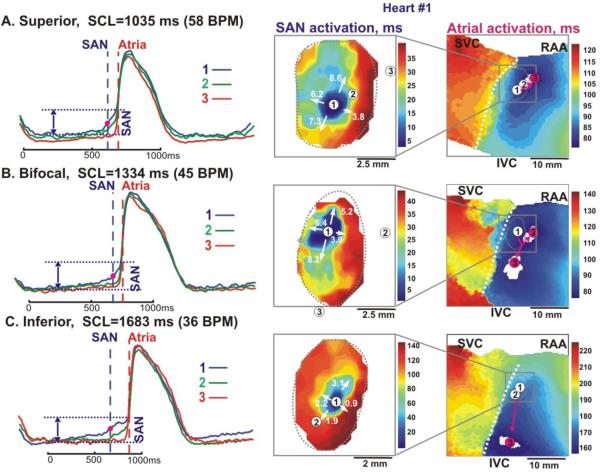
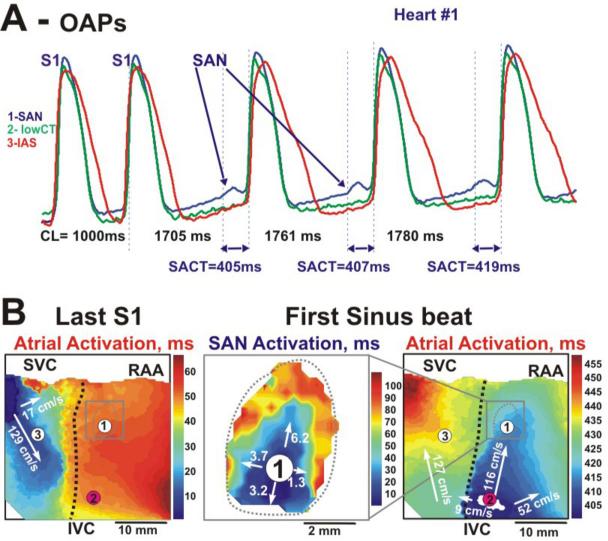
Results: Optical recordings from the SAN had diastolic depolarization and multiple upstroke components, which corresponded to the separate excitations of the SAN and atrial layers. Excitation originated in the middle of the SAN (66 ± 17 beats/min), and then spread slowly (1 to 18 cm/s) and anisotropically. After a 82 ± 17 ms conduction delay within the SAN, the atrial myocardium was excited via superior, middle, and/or inferior sinoatrial conduction pathways. Atrial excitation was initiated 9.4 ± 4.2 mm from the leading pacemaker site. The oval 14.3 ± 1.5 mm × 6.7 ± 1.6 mm × 1.0 ± 0.2 mm SAN structure was functionally insulated from the atrium by connective tissue, fat, and coronary arteries, except for these pathways.

Conclusions: These data demonstrated for the first time, to our knowledge, the location of the leading SAN pacemaker site, the pattern of excitation within the human SAN, and the conduction pathways into the right atrium. The existence of these pathways explains why, even during normal sinus rhythm, atrial breakthroughs could arise from a region parallel to the crista terminalis that is significantly larger (26.1 ± 7.9 mm) than the area of the anatomically defined SAN.


Figures

Figure 1
Figure 1. Epicardial optical mapping of the human right atrial preparation #1
Panel A - Epicardial photographs of a perfused human atrial preparation with a 33×33 mm optical field of view (OFV). The pink circle shows superior atrial breakthrough and white circles show all other breakthroughs recorded by optical mapping (see panel C, and Figure 4). The SAN arteries are shown by blue dotted lines. The white dashed line shows the location of the sulcus terminalis, which is the medial epicardial edge of the crista terminalis (CT). The red oval shows the approximate border of the SAN region. In all panels, the black dashed line shows the location of the IAS block zone (Block). Panel B Optical action potentials from the center of the SAN (1), the atrial breakthrough in CT (2), and Block area (3) from sites 1 –3 in panels A and C during normal SR. Optical recordings show the complex morphology that reflects electrical activity from multiple layers of the tissue, including slowly rising upstrokes of the SAN (SAN component) and rapidly rising upstrokes of the atrial myocardium (Atrial component) above the SAN layer. Panel C – Separated SAN and atrial activation maps, and slow diastolic depolarization (SDD) map. The grey squares on the Atrial and SDD maps show the SAN region that was mapped. White numbers with arrows show values of the conduction velocities in these directions. Panel D - This panel shows a single transmural histology section from the center part of the SAN. Abbreviations: SVC and IVC, superior and inferior vena cava; RAA, right atrial appendage; IAS, intra-atrial septum, SCL, sinus cycle length; SACT, sino-atrial conduction time, AP50% – 50% of the amplitude of the SAN component, dV/dtmax – maximum derivative of the atrial upstroke.
Figure 2
Figure 2. Optical mapping of the SAN excitation during superior, bifocal and inferior atrial breakthrough pattern (heart #1)
The Panels A, B and C, left – Optical action potentials recorded from sites 1–3 on the activation maps, respectively. These optical potentials were recorded before and after atrial pacing for 5–10 min. Vertical dashed lines show the beginning of SAN and Atrial activations, respectively. The Panels A, B and C, middle and right - Activation maps of the SAN and atrial components, during superior, bifocal and inferior atrial breakthrough patterns, respectively. In all panels, the pink circles show sites of atrial breakthrough; the pink arrows represent the sinoatrial pathways from the SAN to the CT. Abbreviations are the same as in Figure 1.
Figure 3
Figure 3. Pacing-induced depression SAN conduction and shift of atrial breakthrough (heart #1)
Panel A - Optical action potentials recorded from three sites depicted in the activation maps (panel B) following the termination of atrial pacing with an S1S1=1000 ms and recovery of spontaneous SAN activity. Recordings from the SAN region demonstrate a slow activation (panel B, middle) from the pacemaker layer more then 400 ms before the atrial component. Panel B - Activation maps during atrial pacing and the first spontaneous SAN excitation after termination of pacing. The first SAN excitation mapped after termination of pacing showed slow propagation, with an average conduction velocity of 3.8 cm/s from the cranial and caudal ends of the SAN. This activation excited the atrial myocardium about 16 mm below the leading pacemaker. The black dotted line shows conduction block to the IAS, which was observed during both pacing and spontaneous excitation. See text for details. Abbreviations are the same as in Figure 1.
Figure 4
Figure 4. Functional and structural features of the human SAN #1
Panels A and C - Two perpendicular perspectives of the human SAN preparation (#1) including anatomical (arteries – blue lines, SAN – red outline) and functional (SEPs – purple arrows, leading pacemaker site – purple dot, breakthrough sites – magenta dots) features. Grey dashed lines represent location of histology sections shown in Panel B and had the same perpendicular orientation as in Panel C. Panel B - A series of representative histology slide images that trace the locations of the arteries (blue) and the SAN (red) from superior to inferior ends of the SAN.
Figure 5
Figure 5. Anatomical 3D model of the human SAN #1
The anatomical features (fibrotic tissue – purple; fat – yellow; green – atrial; SAN – red) in the series of 20 perpendicular histology sections seen in Figure 4 were outlined and Rhinoceros software was used to reconstruct a 3D model of the human SAN #1. This model related the structural features with the functional observations (SEP – gold pathways, leading pacemaker excitation – white oval and arrows). Panel A – A collection of side projection images, which displays the multiple layers surrounding the human SAN. Panel B – Top epicardial projections of the SAN tissues with arteries and SEPs. Panels C and D – Cross-sections in the zy- and zx-planes respectively. Panel E –Histology image of the zx-plane view in Panel D.

Comment in

  • The tell-tale heart (now, optically mapped).
    Valderrábano M, Dave AS. Valderrábano M, et al. J Am Coll Cardiol. 2010 Oct 19;56(17):1395-6. doi: 10.1016/j.jacc.2010.05.042. J Am Coll Cardiol. 2010. PMID: 20946996 No abstract available.

References

    1. Boyett MR, Honjo H, Kodama I. The sinoatrial node, a heterogeneous pacemaker structure. Cardiovasc Res. 2000;47:658–687. - PubMed
    1. Opthof T, de Jonge B, Jongsma HJ, et al. Functional morphology of the mammalian sinuatrial node. Eur Heart J. 1987;8:1249–1259. - PubMed
    1. Verkerk AO, van Ginneken AC, Wilders R. Pacemaker activity of the human sinoatrial node: role of the hyperpolarization-activated current, I(f) Int J Cardiol. 2009;132:318–336. - PubMed
    1. Schuessler RB. Abnormal sinus node function in clinical arrhythmias. J Cardiovasc Electrophysiol. 2003;14:215–217. - PubMed
    1. Bromberg BI, Hand DE, Schuessler RB, et al. Primary negativity does not predict dominant pacemaker location: implications for sinoatrial conduction. Am J Physiol. 1995;269:H877–H887. - PubMed

Publication types