. 2010 Oct 13;18(10):1289-99.
doi: 10.1016/j.str.2010.07.011.

The Structure of the talin head reveals a novel extended conformation of the FERM domain

Affiliations

The Structure of the talin head reveals a novel extended conformation of the FERM domain

Paul R Elliott et al. Structure. .

Abstract

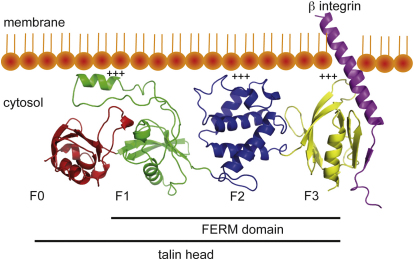
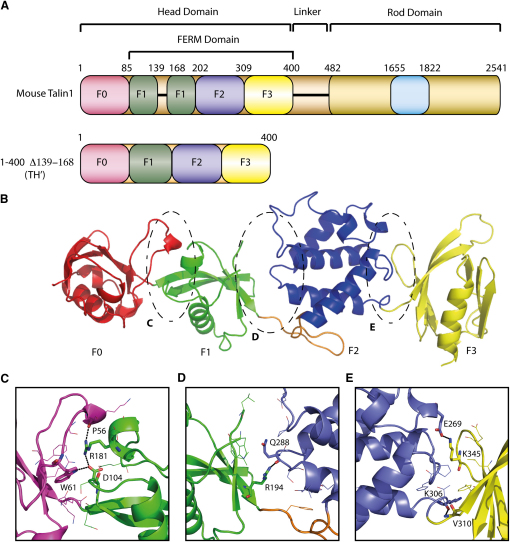
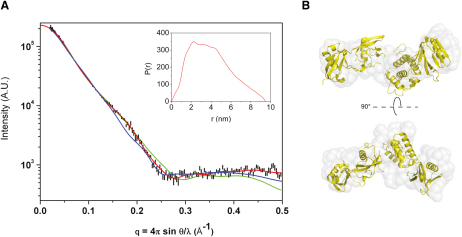
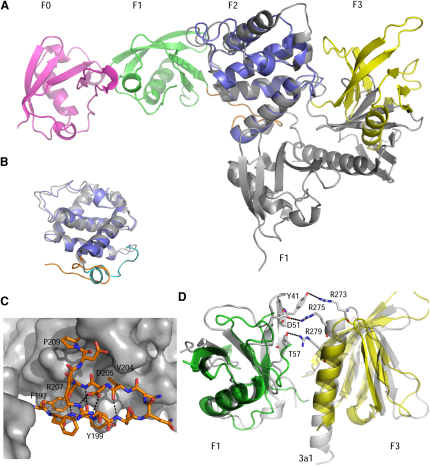
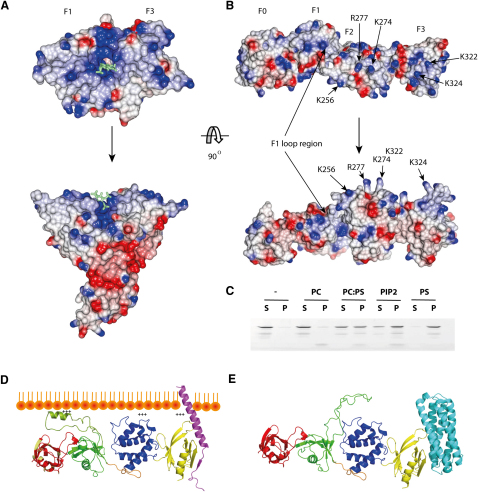
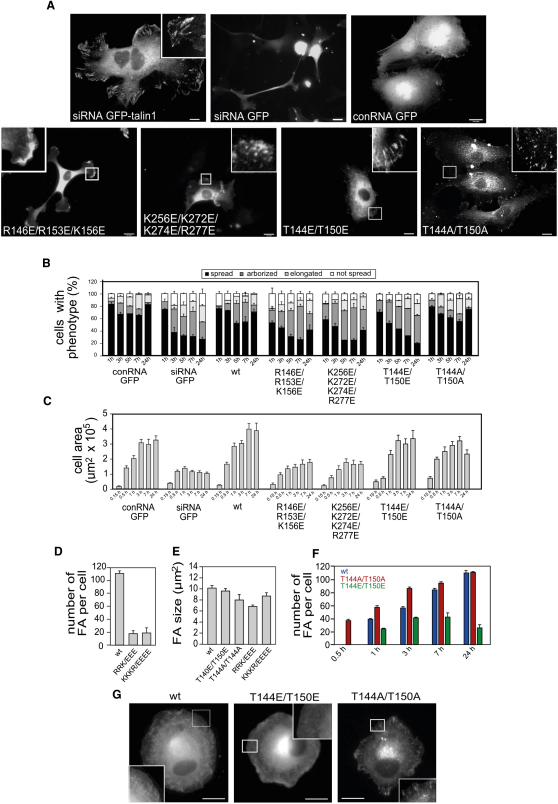
FERM domains are found in a diverse superfamily of signaling and adaptor proteins at membrane interfaces. They typically consist of three separately folded domains (F1, F2, F3) in a compact cloverleaf structure. The crystal structure of the N-terminal head of the integrin-associated cytoskeletal protein talin reported here reveals a novel FERM domain with a linear domain arrangement, plus an additional domain F0 packed against F1. While F3 binds β-integrin tails, basic residues in F1 and F2 are required for membrane association and for integrin activation. We show that these same residues are also required for cell spreading and focal adhesion assembly in cells. We suggest that the extended conformation of the talin head allows simultaneous binding to integrins via F3 and to PtdIns(4,5)P2-enriched microdomains via basic residues distributed along one surface of the talin head, and that these multiple interactions are required to stabilize integrins in the activated state.


Figures

None
Graphical abstract
Figure 1
Figure 1
Domain Composition and Crystal Structure of the Talin1 Head Region (A) Overall domain architecture of talin1 and the fragment TH′ used for crystallization (residues 1–400 with F1 loop 139–168 removed). The autoinhibition domain 1655–1822 in the talin rod is marked in cyan. The color scheme for the talin domains is maintained in all figures. (B) Ribbon diagram of the structure of the talin1 head domain containing ubiquitin-like domains F0 (magenta) and F1 (green), acyl-CoA-binding protein-like domain F2 (blue) and PTB-like domain F3 (yellow). The F1-F2 linker region is marked in orange. The interfaces between the domains are encircled and expanded below. (C–E) Expanded regions of the interfaces between the F0-F1 (C), F1-F2 (D), and F2-F3 (E) domains showing the contacting residues. See also Figure S1.
Figure 2
Figure 2
SAXS Analysis of the Talin1 Head (A) Comparison between the experimental scattering profile (black) and profiles calculated from the crystal structure (blue), from ab initio shape reconstruction with GASBOR (red) and by the BUNCH method (green), generated with the two double domains F0F1 and F2F3 as independent rigid bodies. The error bars of the experimental curve represent 1 SD. The goodness of fit of the crystal structure, GASBOR, and BUNCH profiles versus experimental data is χ2 = 3.8, 1.6, and 3.2, respectively. Inset shows the pair distance distribution function P(r) for the talin head at 4°C. (B) GASBOR shape envelope (transparent gray surface) superimposed with the BUNCH model (yellow). The two orientations shown are related by a 90° rotation around the horizontal axis. See also Figure S2.
Figure 3
Figure 3
Structural Features Specific to the Talin1 FERM Domain (A) Comparison of the talin head structure and the structure of the radixin FERM domain (gray) based on the superposition of the F2 domain of each protein. (B) Superposition of the F2 domain of talin (blue) and radixin (gray) showing different orientations and conformations of the F1-F2 linker region. Talin linker region is marked in orange, radixin in cyan. (C) Docking of the β-hairpin formed in the F1-F2 linker region of talin (stick representations) against the surface of the F2 domain (gray). Residues stabilizing the hairpin packing are marked. The hydrogen bonds in the hairpin are represented by dashed lines. The molecule orientation is as in (B). (D) Modeling of the F1 and F3 domains of talin (green and yellow, respectively) onto the radixin structure (PDB ID 1GC7; gray). Residues forming contacts between the F1 and F3 domains of radixin are shown in stick representation and marked. No similar contacts can be formed in talin due to residue deletions and substitutions. See also Figure S3.
Figure 4
Figure 4
Distribution of Functional Residues on the Surface of the Talin1 Head (A and B) Comparison of the surface charge distribution in radixin (1GC7) (A) and TH′ (B). Both proteins have one face that is predominantly positively charged (top). For TH′, the positive charges are distributed along the entire molecule, while in radixin the positive charges are clustered around the F1-F3 interface. The molecules are additionally shown rotated −90° along the x axis. Residues in talin identified as being involved in interactions with the phospholipid bilayer (Anthis et al., 2009; Wegener et al., 2007) are indicated. Their location on a single face suggests that the top view is the membrane-binding surface in talin. The inositol-3-phosphate binding site on radixin (shown as a light green stick structure) identifies the membrane-binding surface in radixin. The positively charged residues of radixin involved in membrane binding are not conserved in talin1. (C) TH′ association with negatively charged phospholipids demonstrated by pull-down of TH′ with large multilamellar vesicles. Lanes 1, 2, no lipid; lanes 3, 4, POPC; lanes 5, 6, 1:4 POPS:POPC; lanes 7, 8, 1:19 PIP2:POPC; lanes 9, 10, POPS. S, supernatant; P, pellet. (D) Model of complex between talin head and the β3-integrin cytoplasmic domain based upon the integrin/talin F3 structure (Wegener et al., 2007) docked against the membrane surface. The helical structure in the F1 insert loop was modeled following (Goult et al., 2010). In this orientation of TH′ all membrane interacting residues are facing the membrane and indicated by plus signs. The linear arrangement of domains in the talin head allows all membrane-binding sites to engage simultaneously in an orientation optimal for the integrin activation. Conserved patch on F0 is marked in light orange. (E) Autoinhibited complex between the talin head and the rod domain 1655–1822 based on the F3/1655–1822 model of (Goult et al., 2009a). The F1 insert loop, absent in TH′, was modeled using the NMR structure of the F1 domain (Goult et al., 2010). See also Figure S4.
Figure 5
Figure 5
Mutations in Basic Residues in the Talin1 F1 and F2 Domains Inhibit Cell Spreading and FA Formation HUVECs were transfected with a talin1 siRNA (or a control RNA; conRNA) plus constructs encoding either wild-type GFP-talin1, the GFP-talin1 FERM domain mutants indicated, or GFP alone. Cells were replated on glass coverslips 72 hr posttransfection and then fixed/stained and imaged 24 hr later. (A) Epifluorescence images showing the localization of GFP or GFP-talin1. (B) Quantitative analysis of cell morphology at various time points after replating (expressed as mean ± SEM) assessed by the following criteria: “spread” = area of cytoplasm is three times bigger than the area of the nucleus; “arborized” = cell with more than five prominent protrusions or more than three axes; “elongated” = cell length at least five times bigger than cell width; “not spread” = area of cytoplasm is equal to or less than three times the area of the nucleus. (C) Time course of cell spreading based on cell area. (D and E) Number (D) and size (E) of GFP-talin1-positive FA quantified using ImageJ 24 hr after replating. (F) Time course of FA formation. Number of GFP-talin1-positive FA per cell is expressed as mean ± SEM. (G) Epifluorescence images of cells treated as described above 30 min after replating, showing the localization of the GFP-talin1 constructs indicated. Wild-type (wt) GFP-talin1. Scale bars, 10 μm.

Comment in

References

    1. Anthis N.J., Wegener K.L., Ye F., Goult B.T., Lowe E.D., Vakonakis I., Bate N., Critchley D.R., Ginsberg M.H., Campbell I.D. The structure of an integrin/talin complex reveals the basis of inside-out signal transduction. EMBO J. 2009;28:3623–3632. - PMC - PubMed
    1. Barret C., Roy C., Montcourrier P., Mangeat P., Niggli V. Mutagenesis of the phosphatidylinositol 4,5-bisphosphate (PIP(2)) binding site in the NH(2)-terminal domain of ezrin correlates with its altered cellular distribution. J. Cell Biol. 2000;151:1067–1080. - PMC - PubMed
    1. Barsukov I.L., Prescot A., Bate N., Patel B., Floyd D.N., Bhanji N., Bagshaw C.R., Lethinic K., Di Paolo G., De Camilli P. Phosphatidylinositol phosphate kinase type 1gamma and beta1-integrin cytoplasmic domain bind to the same region in the talin FERM domain. J. Biol. Chem. 2003;278:31202–31209. - PubMed
    1. Bernado P., Mylonas E., Petoukhov M.V., Blackledge M., Svergun D.I. Structural characterization of flexible proteins using small-angle X-ray scattering. J. Am. Chem. Soc. 2007;129:5656–5664. - PubMed
    1. Bouaouina M., Lad Y., Calderwood D.A. The N-terminal domains of talin cooperate with the phosphotyrosine binding-like domain to activate β1 and β3 integrins. J. Biol. Chem. 2008;283:6118–6125. - PubMed

Publication types

MeSH terms

Associated data

LinkOut - more resources