

Visualization of the protein-coding regions with a self adaptive spectral rotation approach
- PMID: 20947567
- PMCID: PMC3017620
- DOI: 10.1093/nar/gkq891
Visualization of the protein-coding regions with a self adaptive spectral rotation approach
Abstract
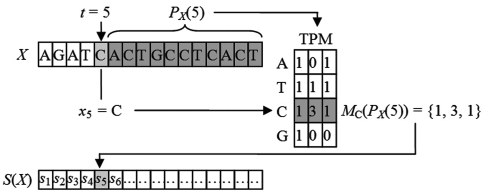
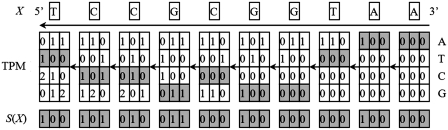
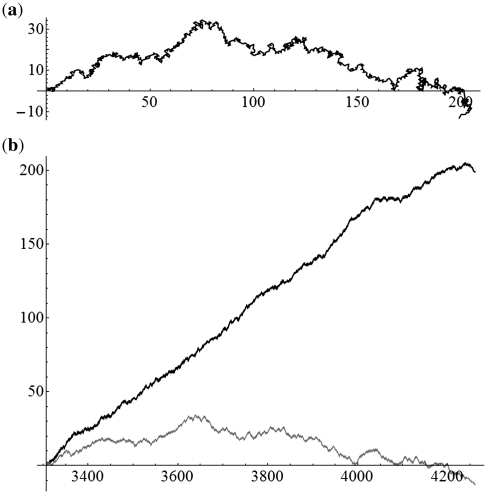
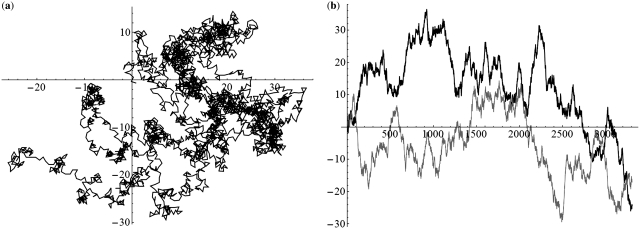
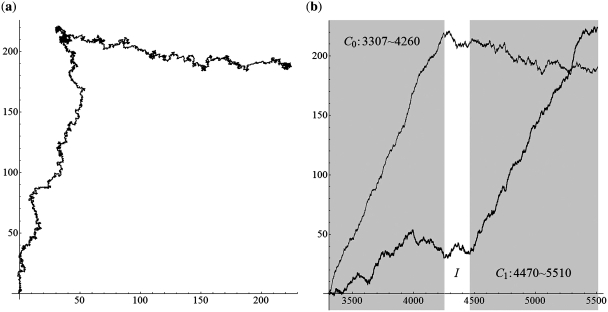
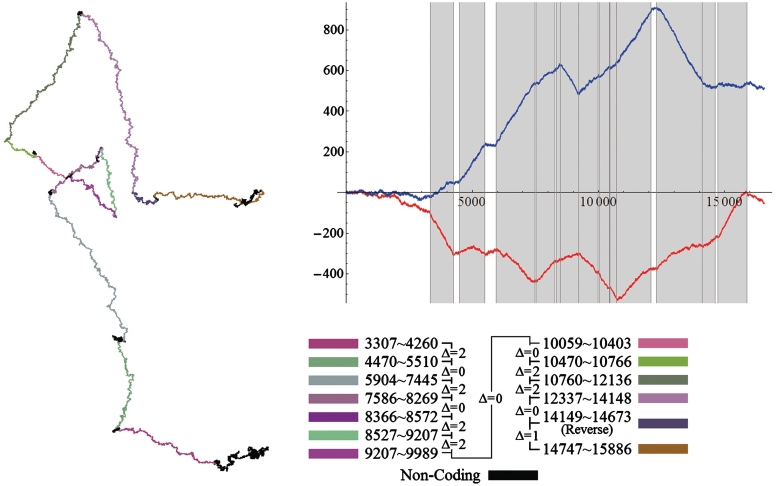
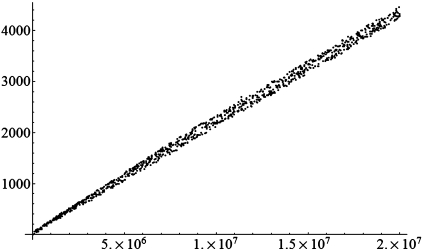
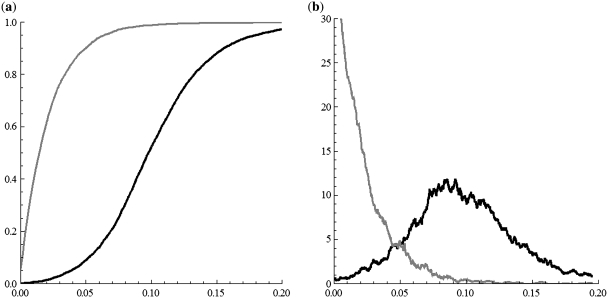
Identifying protein-coding regions in DNA sequences is an active issue in computational biology. In this study, we present a self adaptive spectral rotation (SASR) approach, which visualizes coding regions in DNA sequences, based on investigation of the Triplet Periodicity property, without any preceding training process. It is proposed to help with the rough coding regions prediction when there is no extra information for the training required by other outstanding methods. In this approach, at each position in the DNA sequence, a Fourier spectrum is calculated from the posterior subsequence. Following the spectrums, a random walk in complex plane is generated as the SASR's graphic output. Applications of the SASR on real DNA data show that patterns in the graphic output reveal locations of the coding regions and the frame shifts between them: arcs indicate coding regions, stable points indicate non-coding regions and corners' shapes reveal frame shifts. Tests on genomic data set from Saccharomyces Cerevisiae reveal that the graphic patterns for coding and non-coding regions differ to a great extent, so that the coding regions can be visually distinguished. Meanwhile, a time cost test shows that the SASR can be easily implemented with the computational complexity of O(N).
Figures
Similar articles
-
Numericalization of the self adaptive spectral rotation method for coding region prediction.J Theor Biol. 2012 Mar 7;296:95-102. doi: 10.1016/j.jtbi.2011.12.002. Epub 2011 Dec 8. J Theor Biol. 2012. PMID: 22178641
-
Prediction of Sphingosine protein-coding regions with a self adaptive spectral rotation method.PLoS One. 2019 Apr 3;14(4):e0214442. doi: 10.1371/journal.pone.0214442. eCollection 2019. PLoS One. 2019. PMID: 30943219 Free PMC article.
-
A Spectral Rotation Method with Triplet Periodicity Property for Planted Motif Finding Problems.Comb Chem High Throughput Screen. 2019;22(10):683-693. doi: 10.2174/1386207322666191129112433. Comb Chem High Throughput Screen. 2019. PMID: 31782356
-
Localizing triplet periodicity in DNA and cDNA sequences.BMC Bioinformatics. 2010 Nov 8;11:550. doi: 10.1186/1471-2105-11-550. BMC Bioinformatics. 2010. PMID: 21059240 Free PMC article.
-
Assessment of protein coding measures.Nucleic Acids Res. 1992 Dec 25;20(24):6441-50. doi: 10.1093/nar/20.24.6441. Nucleic Acids Res. 1992. PMID: 1480466 Free PMC article. Review.
Cited by
-
Categorical spectral analysis of periodicity in human and viral genomes.Nucleic Acids Res. 2013 Feb 1;41(3):1395-405. doi: 10.1093/nar/gks1261. Epub 2012 Dec 14. Nucleic Acids Res. 2013. PMID: 23241388 Free PMC article.
-
An approach for searching insertions in bacterial genes leading to the phase shift of triplet periodicity.Genomics Proteomics Bioinformatics. 2011 Oct;9(4-5):158-70. doi: 10.1016/S1672-0229(11)60019-3. Genomics Proteomics Bioinformatics. 2011. PMID: 22196359 Free PMC article.
-
Identification of a circular code periodicity in the bacterial ribosome: origin of codon periodicity in genes?RNA Biol. 2020 Apr;17(4):571-583. doi: 10.1080/15476286.2020.1719311. Epub 2020 Feb 11. RNA Biol. 2020. PMID: 31960748 Free PMC article.
References
-
- Bennetzen JL, Hall BD. Codon selection in yeast. J. Biol. Chem. 1982;257:3026–3031. - PubMed
-
- Peng CK, Buldyrev SV, Goldberger AL, Havlin S, Sciortino F, Simons M, Stanley HE. Long-range correlations in nucleotide sequences. Nature. 1992;356:168–170. - PubMed
-
- Li W. The complexity of DNA. Complexity. 1997;3:33–37.
Publication types
MeSH terms
Substances
LinkOut - more resources
Full Text Sources
Molecular Biology Databases
