Selection at linked sites shapes heritable phenotypic variation in C. elegans
- PMID: 20947766
- PMCID: PMC3138179
- DOI: 10.1126/science.1194208
Selection at linked sites shapes heritable phenotypic variation in C. elegans
Abstract
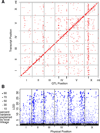
Mutation generates the heritable variation that genetic drift and natural selection shape. In classical quantitative genetic models, drift is a function of the effective population size and acts uniformly across traits, whereas mutation and selection act trait-specifically. We identified thousands of quantitative trait loci (QTLs) influencing transcript abundance traits in a cross of two Caenorhabditis elegans strains; although trait-specific mutation and selection explained some of the observed pattern of QTL distribution, the pattern was better explained by trait-independent variation in the intensity of selection on linked sites. Our results suggest that traits in C. elegans exhibit different levels of variation less because of their own attributes than because of differences in the effective population sizes of the genomic regions harboring their underlying loci.
Figures


Comment in
-
Evolution. Variation catches a ride.Science. 2010 Oct 15;330(6002):326-7. doi: 10.1126/science.1197700. Science. 2010. PMID: 20947750 No abstract available.
-
Quantitative traits: Variants dragged down by their neighbours.Nat Rev Genet. 2010 Dec;11(12):816-7. doi: 10.1038/nrg2911. Epub 2010 Nov 3. Nat Rev Genet. 2010. PMID: 21045870 No abstract available.
References
-
- Houle D. How should we explain variation in the genetic variance of traits? Genetica. 1998;102–103:241–253. - PubMed
-
- Rifkin SA, Kim J, White KP. Evolution of gene expression in the Drosophila melanogaster subgroup. Nat Genet. 2003;33:138–144. - PubMed
-
- Denver DR, et al. The transcriptional consequences of mutation and natural selection in Caenorhabditis elegans. Nat Genet. 2005;37:544–548. - PubMed
Publication types
MeSH terms
Associated data
- Actions
Grants and funding
LinkOut - more resources
Full Text Sources
Molecular Biology Databases

