. 2010 Oct 15;330(6002):376-9.
doi: 10.1126/science.1192001.

Rapid construction of empirical RNA fitness landscapes

Affiliations

Rapid construction of empirical RNA fitness landscapes

Jason N Pitt et al. Science. .

Abstract

Evolution is an adaptive walk through a hypothetical fitness landscape, which depicts the relationship between genotypes and the fitness of each corresponding phenotype. We constructed an empirical fitness landscape for a catalytic RNA by combining next-generation sequencing, computational analysis, and "serial depletion," an in vitro selection protocol. By determining the reaction rate constant for every point mutant of a catalytic RNA, we demonstrated that abundance in serially depleted pools correlates with biochemical activity (correlation coefficient r = 0.67, standard score Z = 7.4). Therefore, enumeration of each genotype by deep sequencing yielded a fitness landscape containing ~10(7) unique sequences, without requiring measurement of the phenotypic fitness for each sequence. High-throughput mapping between genotype and phenotype may apply to artificial selections, host-pathogen interactions, and other biomedically relevant evolutionary phenomena.


Figures
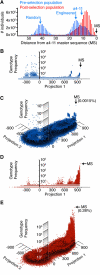
Fig. 1
Fig. 1. Population structure before and after one round of in vitro selection
(A) Histograms of RNA ligase ribozyme populations before (blue) and after (red) in vitro selection (6.7 × 10⁶ sequences each). Sequences are binned according to their Hamming distance (28) from the ‘a4-11′ (11) master sequence (MS) (13). (B, C) Pre-selection mutant spectrum (13, 19). Each spot is a unique species. Projection axes 1 and 2 are hash scores to the master sequence and an arbitrary string, respectively. Genotype frequency is the number of times a sequence was observed (13). (D, E) Mutant spectrum after one 24-hour in vitro selection step.
Fig. 2
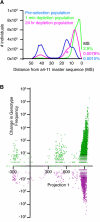
Fig. 2. Changes in population structure during serial depletion
(A) Hamming distance histograms from serial depletion, showing genotype frequencies from the pre-selection (blue), and one minute (green) and 24 hour (pink) time points. Frequencies of the master sequence in the three populations are indicated. Asterisk denotes a subpopulation that is dominated by the parental sequence (14) of the engineered pool. (B) Rates of depletion of genotypes most abundant in the one minute time-point (green) and those most abundant in the 24 hour time-point (magenta) as a function of their similarity to the master sequence.
Fig. 3
Fig. 3. Genotype frequency correlates positively with experimental rate constants
(A) kobs (green, measured in triplicate, error bars represent SOM) and information content (black) for the entire populations from each serial depletion time-point. (B) Correlation between biochemically measured kobs of individual point mutants (Table S3) and observed frequencies of the mutations (Table S4) in all sequence variants with Hamming distance ≤ 8 from the master sequence (red line, r = 0.67) (17). Green line is the kobs of the master sequence (14). Dashed lines denote two independent estimates of the lower detection limit of the biochemical assay (13). (B) Histogram of correlation coefficients of kobs (n = 135) with randomly reassorted mutation frequencies. The real correlation (r = 0.67) between the mutant frequencies in the selection and the experimental kobs is 7.4 standard deviations from the mean.
Fig. 4
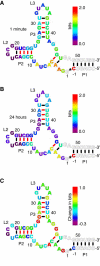
Fig. 4. Analysis of the experimentally constructed fitness landscape as information content per position
Information content of a position in bits (15, 16) of genotypes with a projection 1 hash score ≥ 800 (Hamming distance of ≤ 8 from the master sequence) and Dmax = 1 minute (A), and Dmax = 24 hours (B) depicted as a heat map. Analyses based on 4,485,943 reads of 311,869 unique sequences, and 586,606 reads of 117,507 unique sequences for (A) and (B), respectively (Fig S5, Tables S5–S8). P1, P2, P3 denote helices, L2 and L3 loops. (C) Change in information content between Dmax = 1 minute and Dmax = 24 hours. Positions 12, 22, 33, 38, 39 appear to be selectively neutral (29). Black and red base-pair symbols indicate pairing predicted from aligning the 256 most common sequences, and from analysis of the Watson-Crick covariation of all sequences with a projection 1 hash score ≥ 800 (13), respectively.

Comment in

  • Evolution. RNA GPS.
    Kluwe C, Ellington AD. Kluwe C, et al. Science. 2010 Oct 15;330(6002):330-1. doi: 10.1126/science.1197667. Science. 2010. PMID: 20947753 No abstract available.

References

    1. Wilson DS, Szostak JW. Annu Rev Biochem. 1999;68:611. - PubMed
    1. Lehman N, Joyce GF. Curr Biol. 1993;3:723. - PubMed
    1. Wright S. Proc Sixth International Congress Genet. 1932;1:355.
    1. Maynard Smith J. Nature. 1970;225:563. - PubMed
    1. Schuster P. European Rev. 2009;17:281.

Publication types