. 2010 Dec 10;107(12):1470-82.
doi: 10.1161/CIRCRESAHA.110.227371. Epub 2010 Oct 14.

Deacetylation of FoxO by Sirt1 Plays an Essential Role in Mediating Starvation-Induced Autophagy in Cardiac Myocytes

Affiliations

Deacetylation of FoxO by Sirt1 Plays an Essential Role in Mediating Starvation-Induced Autophagy in Cardiac Myocytes

Nirmala Hariharan et al. Circ Res. .

Abstract

Rationale: autophagy, a bulk degradation process of cytosolic proteins and organelles, is protective during nutrient starvation in cardiomyocytes (CMs). However, the underlying signaling mechanism mediating autophagy is not well understood.

Objective: we investigated the role of FoxOs and its posttranslational modification in mediating starvation-induced autophagy.

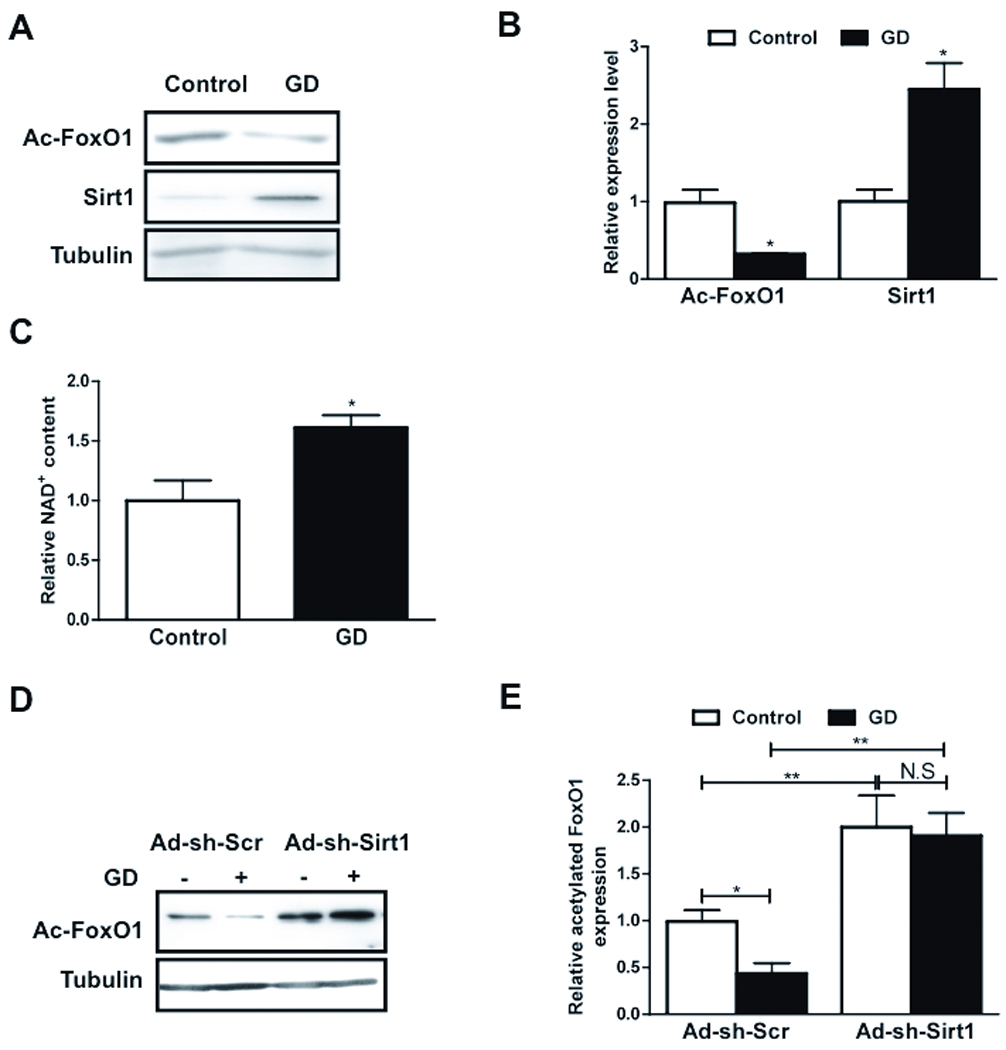
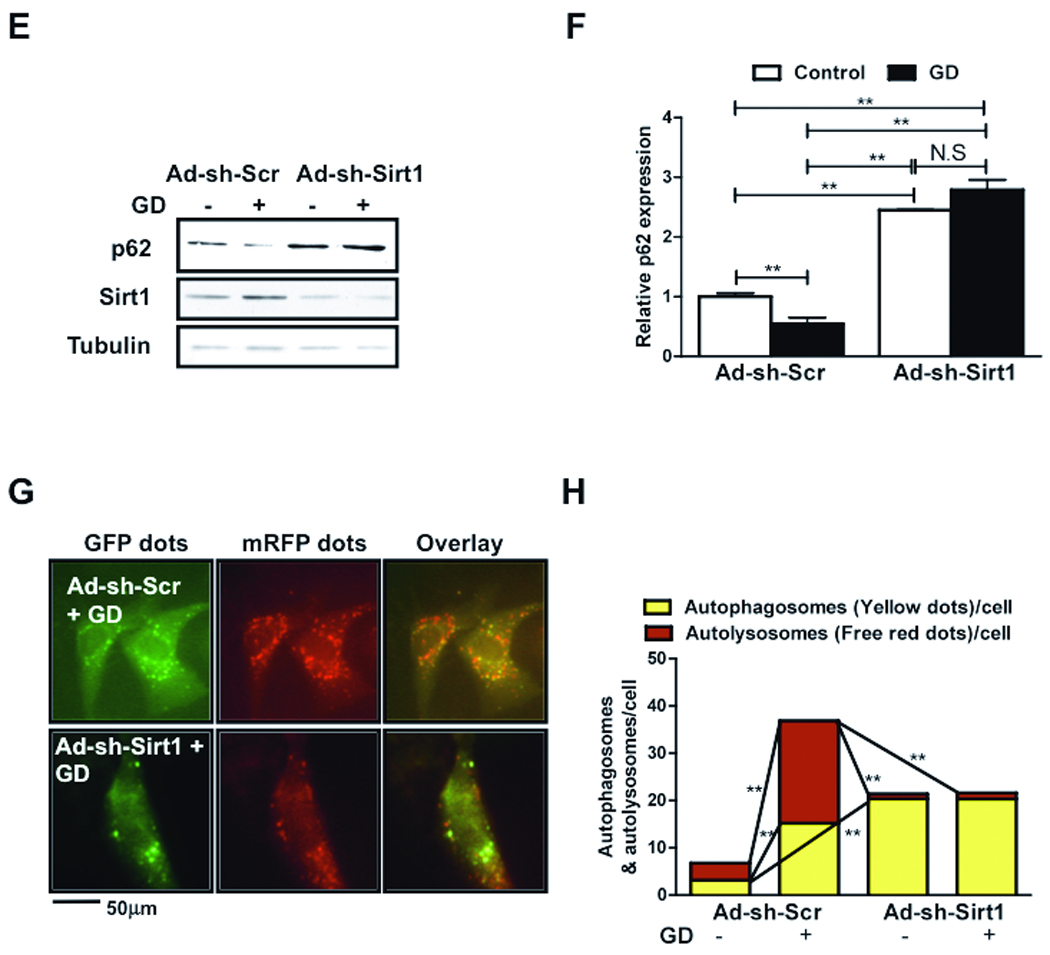
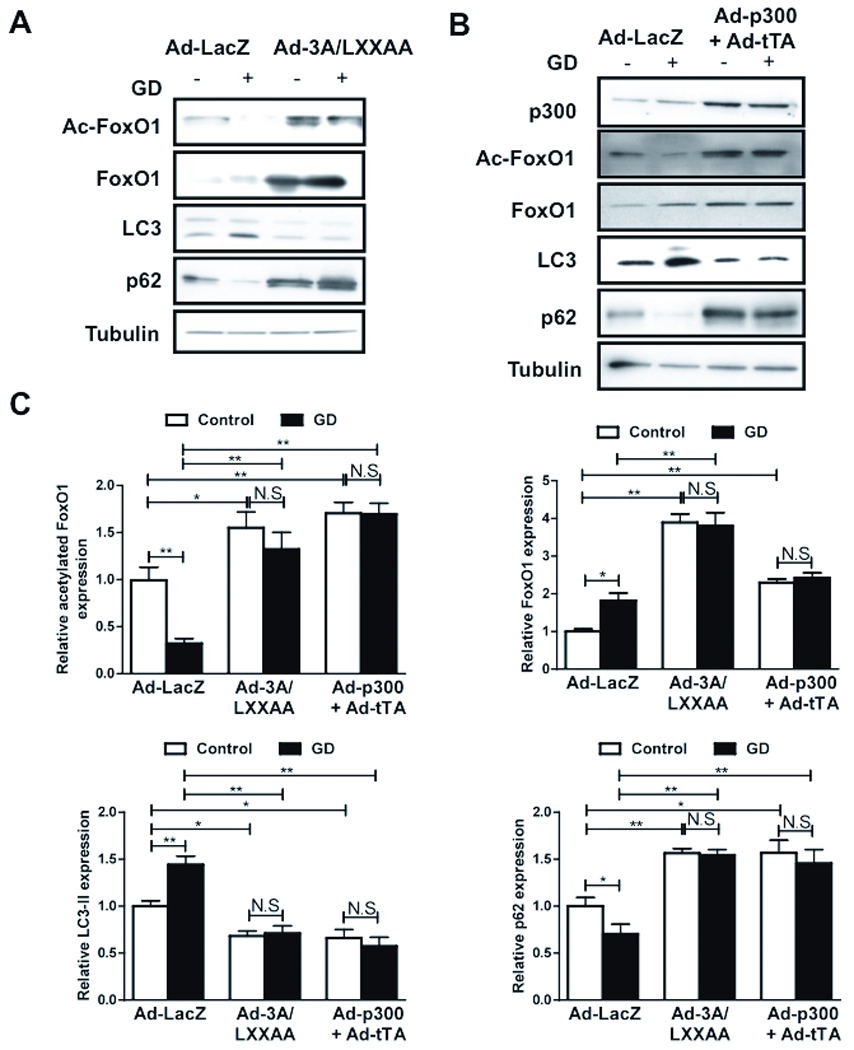
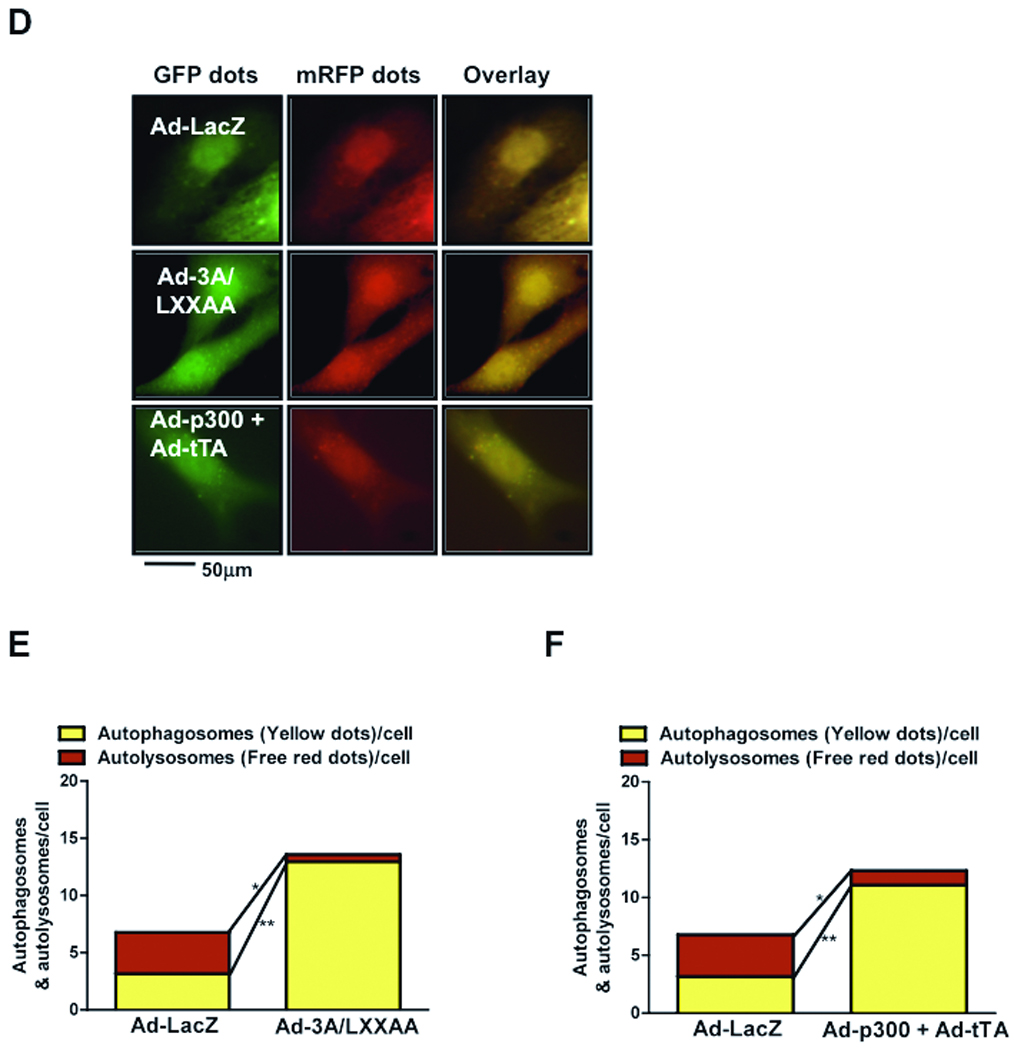
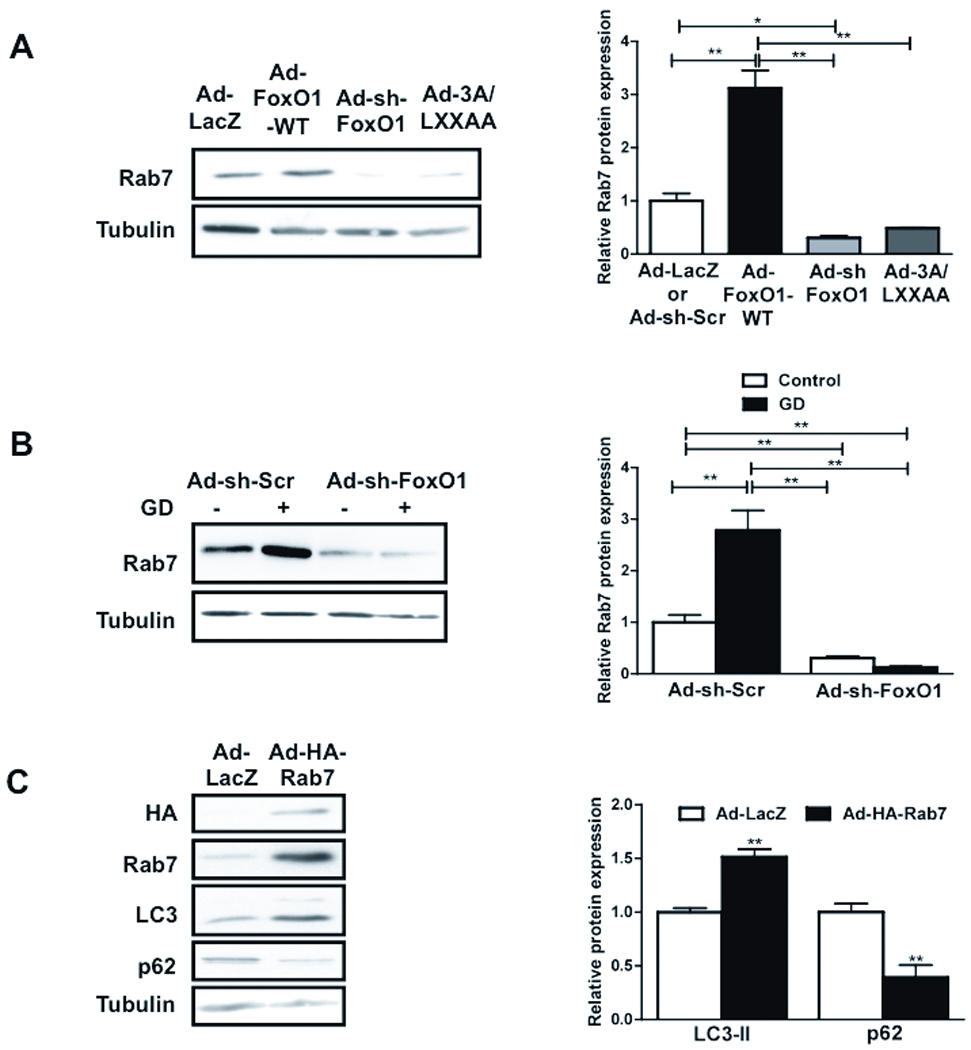
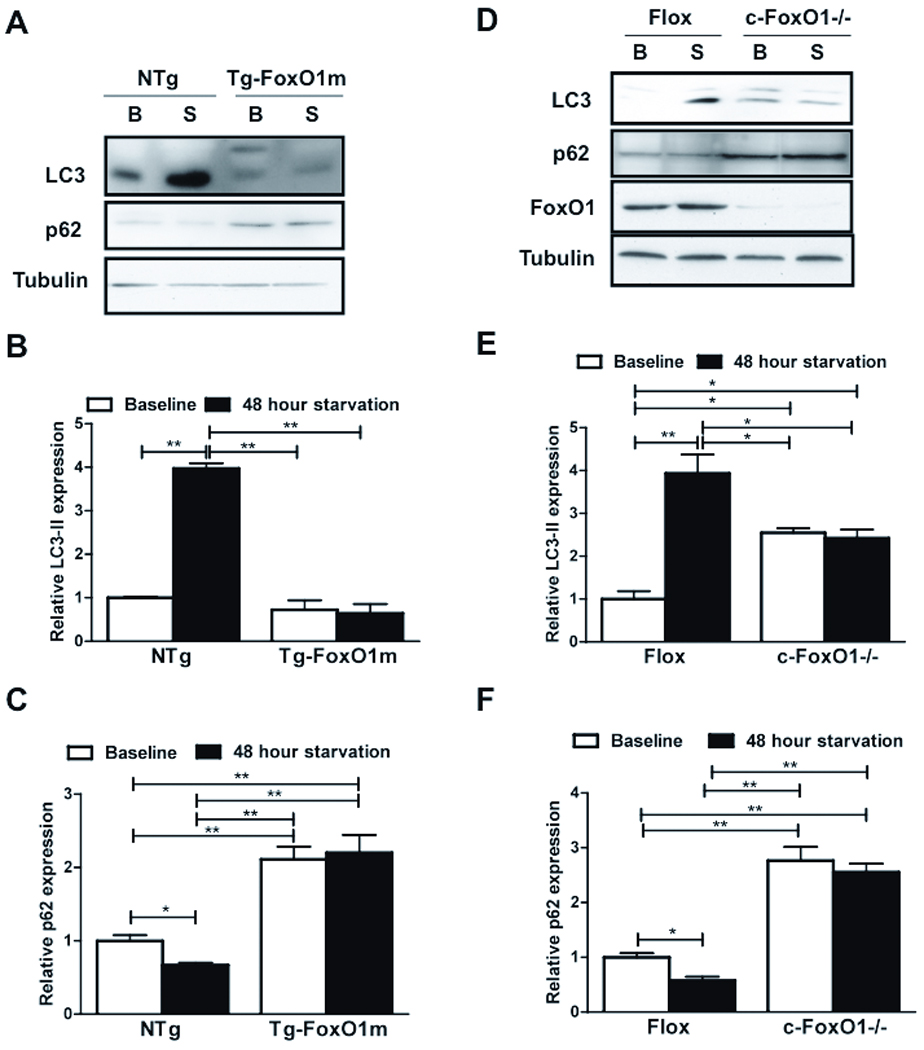
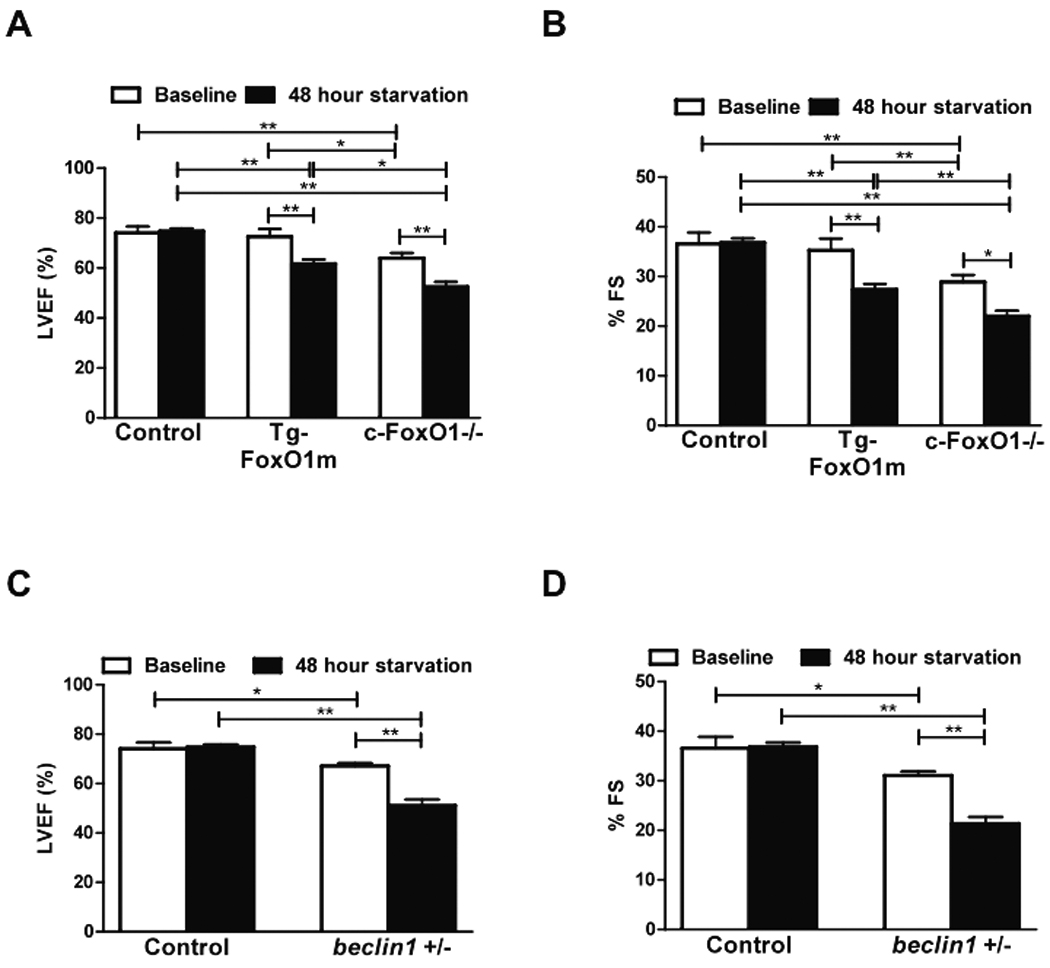
Methods and results: glucose deprivation (GD) increased autophagic flux in cultured CMs, as evidenced by increased mRFP-GFP-LC3 puncta and decreases in p62, which was accompanied by upregulation of Sirt1 and FoxO1. Overexpression of either Sirt1 or FoxO1 was sufficient for inducing autophagic flux, whereas both Sirt1 and FoxO1 were required for GD-induced autophagy. GD increased deacetylation of FoxO1, and Sirt1 was required for GD-induced deacetylation of FoxO1. Overexpression of FoxO1(3A/LXXAA), which cannot interact with Sirt1, or p300, a histone acetylase, increased acetylation of FoxO1 and inhibited GD-induced autophagy. FoxO1 increased expression of Rab7, a small GTP-binding protein that mediates late autophagosome-lysosome fusion, which was both necessary and sufficient for mediating FoxO1-induced increases in autophagic flux. Although cardiac function was maintained in control mice after 48 hours of food starvation, it was significantly deteriorated in mice with cardiac-specific overexpression of FoxO1(3A/LXXAA), those with cardiac-specific homozygous deletion of FoxO1 (c-FoxO1(-/-)), and beclin1(+/-) mice, in which autophagy is significantly inhibited.

Conclusions: these results suggest that Sirt1-mediated deacetylation of FoxO1 and upregulation of Rab7 play an important role in mediating starvation-induced increases in autophagic flux, which in turn plays an essential role in maintaining left ventricular function during starvation.


Figures

Figure 1
Figure 1. GD induces autophagy in cultured CMs with enhanced FoxO1 expression
Neonatal rat CMs were transduced with Ad-LacZ and incubated in serum free media or treated with serum free-glucose free media. A) Immunoblot analyses.B) Densitometric analyses. C-E) CMs were transduced with Ad-tf-LC3 and Ad-LacZ and treated with glucose free media. C) Representative images of fluorescent LC3 puncta. Arrows indicate red puncta that overlay with green puncta indicating autophagosomes. D) Mean number of green and red puncta per cell. E) Mean number of autophagosomes (puncta with both red and green colors, i.e puncta with yellow color in merged images) and autolysosomes (puncta with only red but not green color, i.e puncta with red color in merged images) per cell. Graph with error bars is shown in Online Figure XI-A. Results represent the means from at least 4 independent experiments. * p<0.05, ** p<0.01.
Figure 2
Figure 2. FoxO1 is required for GD-induced autophagy in CMs
CMs were transduced with Ad-FoxO1-WT or Ad-LacZ, Ad-sh-FoxO1 or Ad-sh-Scr. A) Immunoblot analyses showing FoxO1, LC3, p62 and Tubulin expressions. B) Densitometric analyses. C) Representative images of fluorescent LC3 puncta after Ad-tf-LC3 transduction. Insets in Ad-FoxO1-WT transduced myocytes show higher magnification. D) Mean number of autophagosomes represented by yellow puncta in merged images and autolysosomes represented by red puncta in merged images per cell. E–H) CMs were transduced with Ad-sh-FoxO1 or Ad-sh-Scr and treated with glucose free media. E) Immunoblots showing p62, FoxO1 and Tubulin expressions. F) Densitometric analyses. G) Representative images of fluorescent LC3 puncta after Ad-tf-LC3 transduction. H) Mean number of autophagosomes represented by yellow puncta in merged images and autolysosomes represented by red puncta in merged images per cell. In D and H, graph with error bars is shown in Online Figure XI-BC. Results represent means from at least 4 independent experiments. * p<0.05, ** p<0.01, N.S Not Significant.
Figure 3
Figure 3. Sirt1 deacetylates FoxO1 during GD in CMs
A–C) CMs were transduced with Ad-LacZ and treated with glucose free media. A) Immunoblots showing acetylated FoxO1 (Ac-FoxO1), Sirt1 and Tubulin expressions. B) Densitometric analyses. C) Relative NAD+ content is shown. D–E) Myocytes were transduced with Ad-sh-Sirt1 or Ad-sh-Scr and were glucose starved. D) Immunoblots showing Ac-FoxO1 and Tubulin expressions. E) Densitometric analyses. Data represent means from at least 4 independent experiments. * p<0.05, ** p<0.01, N.S Not significant.
Figure 4
Figure 4. Sirt1 is required to mediate GD-induced autophagy in CMs
CMs were transduced with Ad-LacZ or Ad-Sirt1, Ad-sh-Sirt1 or Ad-sh-Scr. A) Immunoblot analyses showing expressions of Sirt1, LC3 (at two different exposure times), p62 and Tubulin. B) Densitometric analyses. C) Representative images of fluorescent LC3 puncta after transduction with Ad-tf-LC3. D) Mean number of autophagosomes represented by yellow puncta in merged images and autolysosomes represented by red puncta in merged images per cell. E-H) CMs were transduced with Ad-sh-FoxO1 or Ad-sh-Scr and treated with glucose free media. E) Immunoblots showing Sirt1, p62 and Tubulin expressions. F) Densitometric analyses. G) Representative images of fluorescent LC3 puncta after Ad-tf-LC3 transduction. H) Mean number of autophagosomes represented by yellow puncta in merged images and autolysosomes represented by red puncta in merged images per cell. In D and H, graph with error bars is shown in Online Figure XI-DE. Data represent means from at least 4 independent experiments. * p<0.05, ** p<0.01, N.S Not Significant.
Figure 5
Figure 5. Interaction with Sirt1 and deacetylation of FoxO1 are required for autophagy in CMs
A) CMs were transduced with Ad-3A/LXXAA or Ad-LacZ and treated with glucose free media. Immunoblots for acetylated FoxO1, total FoxO1, LC3, p62 and Tubulin. B) CMs were transduced with Ad-p300 and Ad-tTA. Immunoblots for p300, acetylated FoxO1, total FoxO1, LC3, p62 and Tubulin. C) Densitometric analyses. D) Representative images of fluorescent LC3 puncta after transduction with Ad-tf-LC3. E–F) Mean number of autophagosomes represented by yellow puncta in merged images and autolysosomes represented by red puncta in merged images per cell. Graph with error bars is shown in Online Figure XI-FG. Data represent means from at least 4 independent experiments. * p<0.05, ** p<0.01, N.S Not Significant.
Figure 6
Figure 6. FoxO1 regulates Rab7 expression and FoxO1-induced autophagy is attenuated by Rab7 knockdown
A) CMs were transduced with Ad-LacZ, Ad-FoxO1-WT, Ad-3A/LXXAA or Ad-sh-FoxO1. Immunoblots and densitometric analyses showing Rab7 expression. B) CMs were transduced with Ad-sh-FoxO1 or Ad-sh-Scr and treated with glucose free media. Immunoblot and densitometric analyses showing Rab7 expression. C) CMs were transduced with Ad-HA-Rab7 or Ad-LacZ. Immunoblots and densitometric analyses. D) CMs were transduced with Ad-LacZ, Ad-FoxO1-WT, Ad-sh-Scr or lentivirus harboring sh-Rab7 (Lt-sh-Rab7) for 96 hours. Immunoblots for LC3 (at two different exposure times) and p62 and densitometric analyses are shown. Data represent means from at least 4 independent experiments. * p<0.05, ** p<0.01.
Figure 7
Figure 7. FoxO1 is required for starvation-induced autophagy in vivo
Tg-FoxO1m, c-FoxO1−/− and NTg or floxed control mice were starved for 48 hours. A) Immunoblots showing expression of LC3, p62 and Tubulin in Tg-FoxO1m mice, both at baseline (B) and after starvation (S). B-C) Densitometric analyses. D) Immunoblots at baseline and after starvation of c-FoxO1−/− mice. E-F) Densitometric analyses. Data represent means from at least 3 individual mice. * p<0.05, ** p<0.01.
Figure 8
Figure 8. FoxO1-induced autophagy is required to maintain cardiac function after starvation
Cardiac function was evaluated in the Tg-FoxO1m, c-FoxO1−/−, beclin1+/− and control mice with echocardiographic analyses both at baseline and after 48 hours of starvation. A–B) Left ventricular ejection fraction (LVEF) and fractional shortening (%FS) in control, Tg-FoxO1m, c-FoxO1−/− mice. C–D) LVEF and FS in control and beclin1+/− mice. * p<0.05, **p<0.01. N=6 in each group.

References

    1. Mizushima N. Autophagy: process and function. Genes Dev. 2007;21:2861–2873. - PubMed
    1. Matsui Y, Takagi H, Qu X, Abdellatif M, Sakoda H, Asano T, Levine B, Sadoshima J. Distinct roles of autophagy in the heart during ischemia and reperfusion: roles of AMP-activated protein kinase and Beclin 1 in mediating autophagy. Circ Res. 2007;100:914–922. - PubMed
    1. Nishida K, Kyoi S, Yamaguchi O, Sadoshima J, Otsu K. The role of autophagy in the heart. Cell Death Differ. 2009;16:31–38. - PubMed
    1. Greer EL, Brunet A. FOXO transcription factors at the interface between longevity and tumor suppression. Oncogene. 2005;24:7410–7425. - PubMed
    1. Mammucari C, Milan G, Romanello V, Masiero E, Rudolf R, Del Piccolo P, Burden SJ, Di Lisi R, Sandri C, Zhao J, Goldberg AL, Schiaffino S, Sandri M. FoxO3 Controls Autophagy in Skeletal Muscle In Vivo. Cell Metab. 2007;6:458–471. - PubMed

Publication types