

Development of Potential Pharmacodynamic and Diagnostic Markers for Anti-IFN-α Monoclonal Antibody Trials in Systemic Lupus Erythematosus
- PMID: 20948567
- PMCID: PMC2950308
- DOI: 10.4061/2009/374312
Development of Potential Pharmacodynamic and Diagnostic Markers for Anti-IFN-α Monoclonal Antibody Trials in Systemic Lupus Erythematosus
Abstract
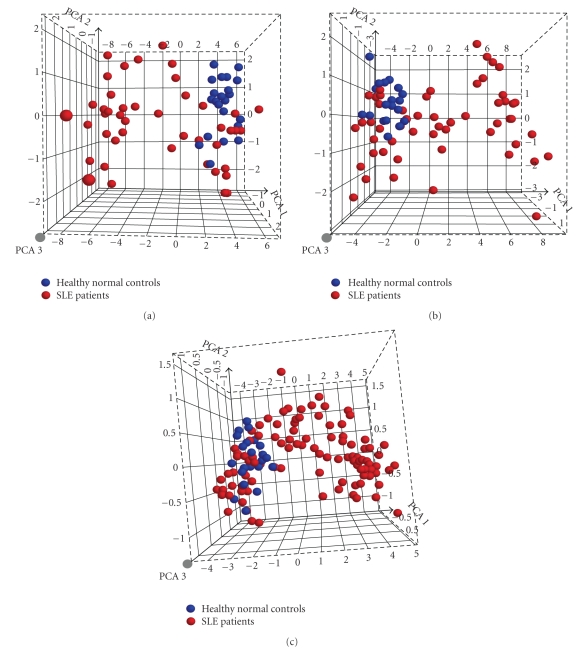
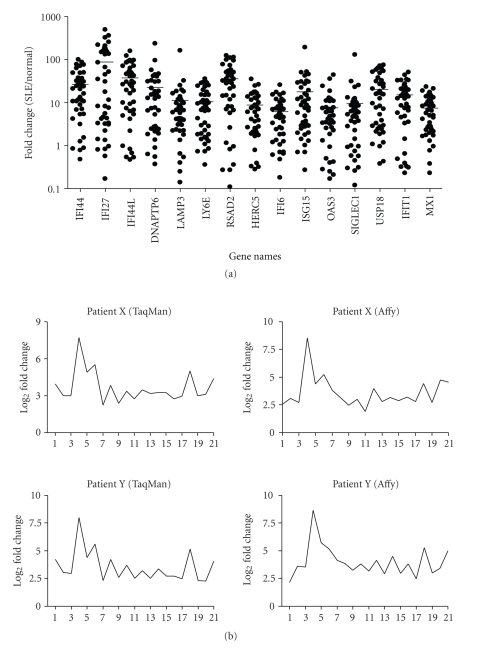
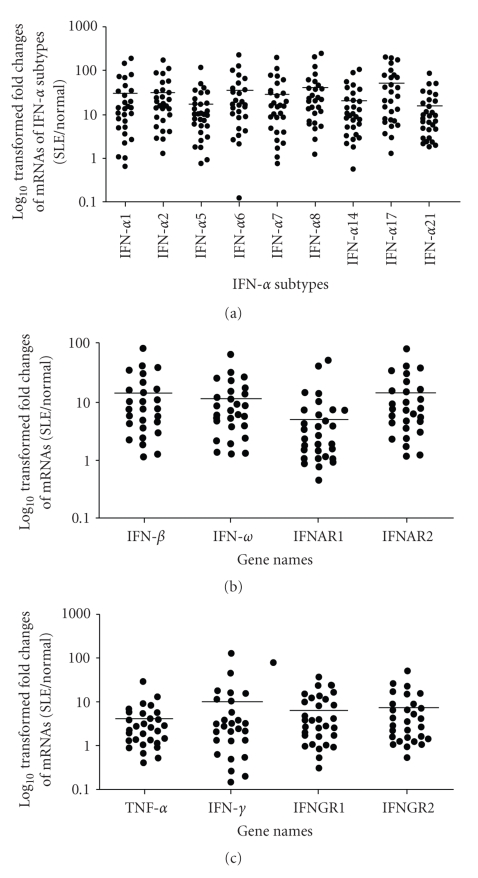
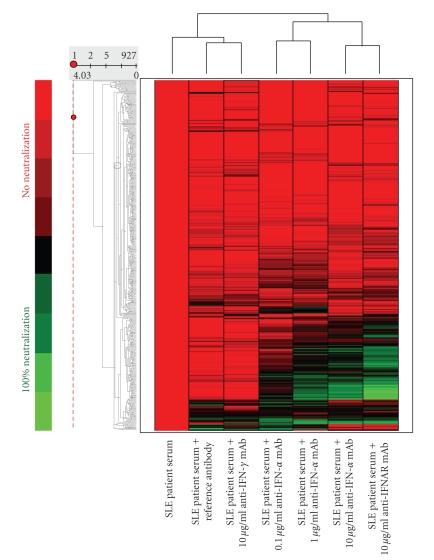
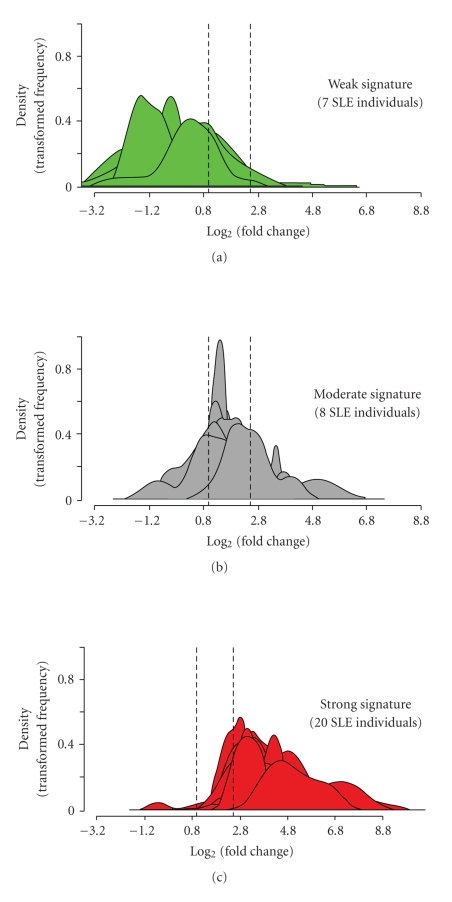
To identify potential pharmacodynamic biomarkers to guide dose selection in clinical trials using anti-interferon-alpha (IFN-α) monoclonal antibody (mAb) therapy for systemic lupus erythematosus (SLE), we used an Affymetrix human genome array platform and identified 110 IFN-α/β-inducible transcripts significantly upregulated in whole blood (WB) of 41 SLE patients. The overexpression of these genes was confirmed prospectively in 54 additional SLE patients and allowed for the categorization of the SLE patients into groups of high, moderate, and weak overexpressers of IFN-α/β-inducible genes. This approach could potentially allow for an accurate assessment of drug target neutralization in early trials of anti-IFN-α mAb therapy for SLE. Furthermore, ex vivo stimulation of healthy donor peripheral blood mononuclear cells with SLE patient serum and subsequent neutralization with anti-IFN-α mAb or anti-IFN-α receptor mAb showed that anti-IFN-α mAb has comparable effects of neutralizing the overexpression of type I IFN-inducible genes as that of anti-IFNAR mAb. These results suggest that IFN-α, and not other members of type I IFN family in SLE patients, is mainly responsible for the induction of type I IFN-inducible genes in WB of SLE patients. Taken together, these data strengthen the view of IFN-α as a therapeutic target for SLE.
Figures
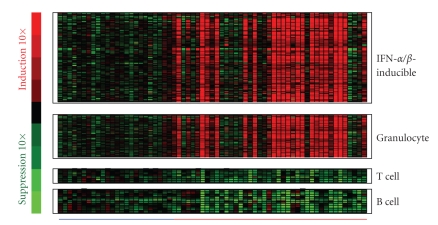
 ) compared with WB from 24 healthy donors (
 ). IFN = interferon; SLE = systemic lupus erythematosus.
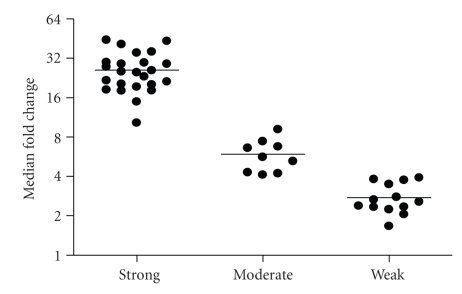

References
-
- United States Food and Drug Administration. Challenge and opportunity on the critical path to new medical products. http://www.fda.gov/oc/initiatives/criticalpath/whitepaper.html#execsummary.
-
- Sarker D, Workman P. Pharmacodynamic biomarkers for molecular cancer therapeutics. Advances in Cancer Research. 2006;96:213–268. - PubMed
-
- United States Food and Drug Administration. Drug-diagnostic co-development concept paper. http://www.fda.gov/Cder/genomics/pharmacoconceptfn.pdf.
-
- Frueh FW. Impact of microarray data quality on genomic data submissions to the FDA. Nature Biotechnology. 2006;24(9):1105–1107. - PubMed
-
- Canales RD, Luo Y, Willey JC, et al. Evaluation of DNA microarray results with quantitative gene expression platforms. Nature Biotechnology. 2006;24(9):1115–1122. - PubMed
LinkOut - more resources
Full Text Sources
Other Literature Sources