. 2010 Aug;7(8):3196-210.
doi: 10.3390/ijerph7083196. Epub 2010 Aug 11.

Relation between temperature and mortality in thirteen Spanish cities

Collaborators, Affiliations

Relation between temperature and mortality in thirteen Spanish cities

Carmen Iñiguez et al. Int J Environ Res Public Health. 2010 Aug.

Abstract

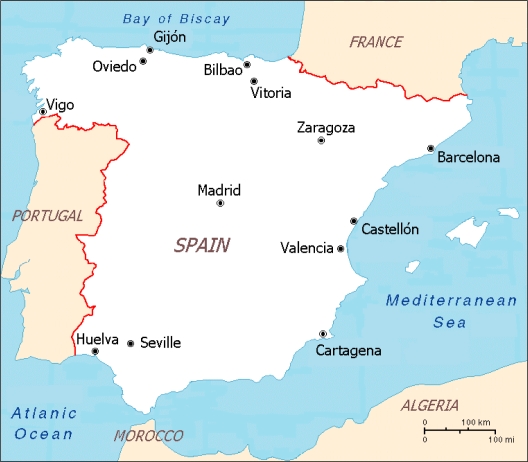
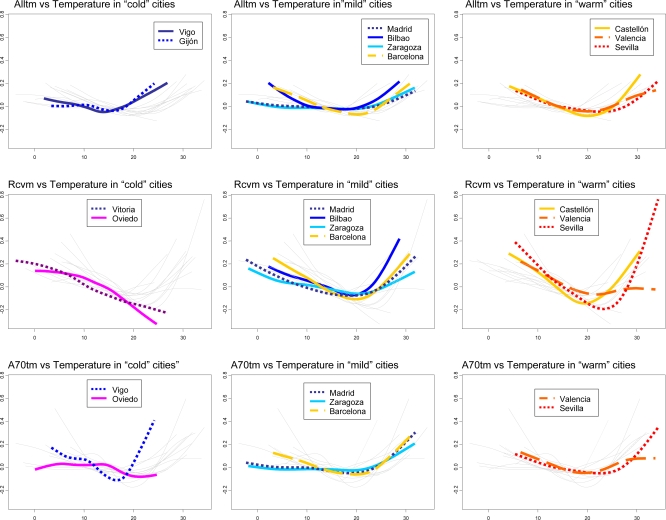
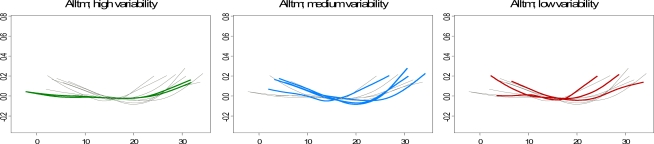
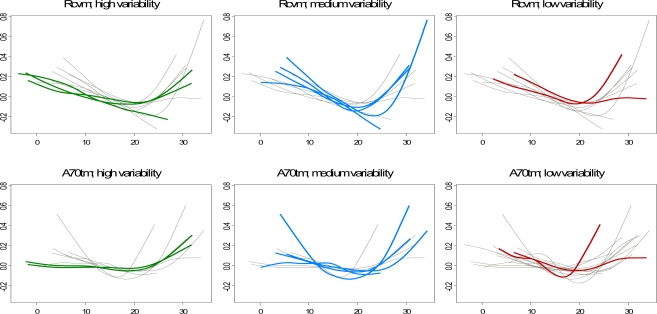
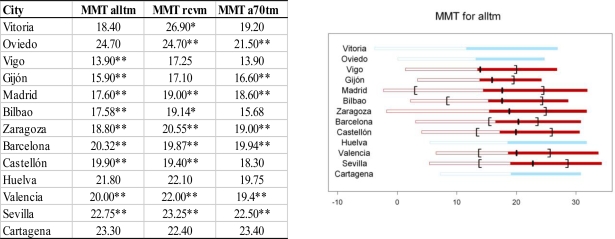
In this study we examined the shape of the association between temperature and mortality in 13 Spanish cities representing a wide range of climatic and socio-demographic conditions. The temperature value linked with minimum mortality (MMT) and the slopes before and after the turning point (MMT) were calculated. Most cities showed a V-shaped temperature-mortality relationship. MMTs were generally higher in cities with warmer climates. Cold and heat effects also depended on climate: effects were greater in hotter cities but lesser in cities with higher variability. The effect of heat was greater than the effect of cold. The effect of cold and MMT was, in general, greater for cardio-respiratory mortality than for total mortality, while the effect of heat was, in general, greater among the elderly.

Keywords: Spain; mortality; temperature.


Figures

Figure 1.
Figure 1.
Spanish cities participating in the study.
Figure 2.
Figure 2.
Curves of significant associations between temperature and mortality for: total mortality (Alltm) in the first row, cardio-respiratory mortality (Rcvm) in the second row, and mortality among people 70 years old or over (A70tm) in the third. Cities are grouped according to their mean temperature into “cold” cities (Vitoria, Oviedo, Vigo, Gijon), “mild” cities (Madrid, Bilbao, Zaragoza, Barcelona) and “warm” cities (Castellón, Valencia, Huelva, Seville, Cartagena). The rest of the curves are drawn in light gray.
Figure 3.
Figure 3.
Curves of significant associations between temperature and mortality for: total mortality (Alltm) in the first row, cardio-respiratory mortality (Rcvm) in the second row, and mortality among people 70 years old or over (A70tm) in the third. Cities are grouped according to their Coefficient of Variation into “high variability” (Vitoria, Madrid, Zaragoza), “medium variability” (Oviedo, Vigo, Barcelona, Castellón, Seville) and “low variability” cities (Gijon, Bilbao, Valencia, Huelva, Cartagena). The rest of the curves are drawn in light gray.
Figure 3.
Figure 3.
Curves of significant associations between temperature and mortality for: total mortality (Alltm) in the first row, cardio-respiratory mortality (Rcvm) in the second row, and mortality among people 70 years old or over (A70tm) in the third. Cities are grouped according to their Coefficient of Variation into “high variability” (Vitoria, Madrid, Zaragoza), “medium variability” (Oviedo, Vigo, Barcelona, Castellón, Seville) and “low variability” cities (Gijon, Bilbao, Valencia, Huelva, Cartagena). The rest of the curves are drawn in light gray.
Figure 4.
Figure 4.
This table includes the temperature associated with minimum mortality (MMT) in each city for total mortality (alltm), mortality due to cardio-respiratory causes (rcvm) and mortality among people 70 years old or over (a70tm). The graphs show: MMT (black segment), the temperature range where the predicted mortality is not statistically different from the minimum mortality (black brackets) and the mean temperature of each city (change from empty to solid box). Red is used for significant associations and blue for non-significant associations. (*) indicates 10% statistically significant associations; (**) indicates 5% statistically significant associations.
Figure 4.
Figure 4.
This table includes the temperature associated with minimum mortality (MMT) in each city for total mortality (alltm), mortality due to cardio-respiratory causes (rcvm) and mortality among people 70 years old or over (a70tm). The graphs show: MMT (black segment), the temperature range where the predicted mortality is not statistically different from the minimum mortality (black brackets) and the mean temperature of each city (change from empty to solid box). Red is used for significant associations and blue for non-significant associations. (*) indicates 10% statistically significant associations; (**) indicates 5% statistically significant associations.

References

    1. Huynen MM, Martens P, Schram D, Weijenberg MP, Kunst AE. The impact of heat waves and cold spells on mortality rates in the Dutch population. Environ. Health Perspect. 2001;109:463–470. - PMC - PubMed
    1. Basu R. High ambient temperature and mortality: A review of epidemiologic studies from 2001 to 2008. Environ Health. 2009;8 doi:10.1186/1476-069X-8-40. - PMC - PubMed
    1. Kunst AE, Looman CW, Mackenbach JP. Outdoor air temperature and mortality in the Netherlands: A times-series analysis. Am. J. Epidemiol. 1993;137:331–341. - PubMed
    1. Braga AL, Zanobetti A, Schwartz J. The time course of weather-related deaths. Epidemiology. 2001;12:662–667. - PubMed
    1. Ballester F, Corella D, Pérez-Hoyos S, Sáez M, Hervás A. Mortality as a function of temperature: a study in Valencia, Spain, 1991–1993. Int. J. Epidemiol. 1997;26:551–561. - PubMed

LinkOut - more resources