. 2010 Aug;7(8):3270-97.
doi: 10.3390/ijerph7083270. Epub 2010 Aug 23.

Do questions reflecting indoor air pollutant exposure from a questionnaire predict direct measure of exposure in owner-occupied houses?

Affiliations

Do questions reflecting indoor air pollutant exposure from a questionnaire predict direct measure of exposure in owner-occupied houses?

C K Jennifer Loo et al. Int J Environ Res Public Health. 2010 Aug.

Abstract

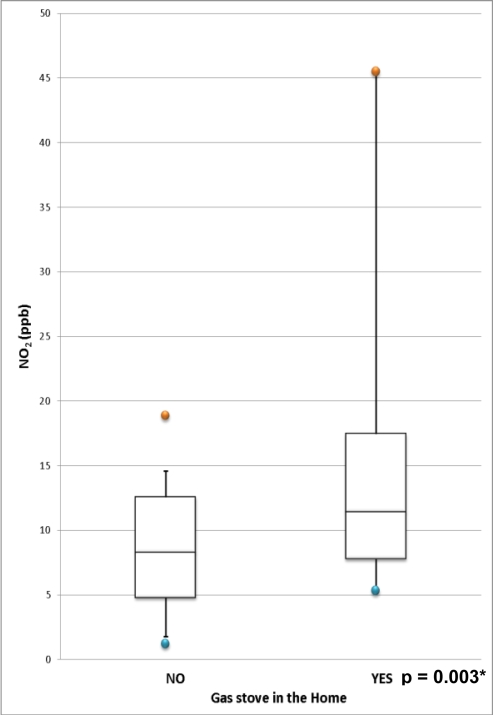
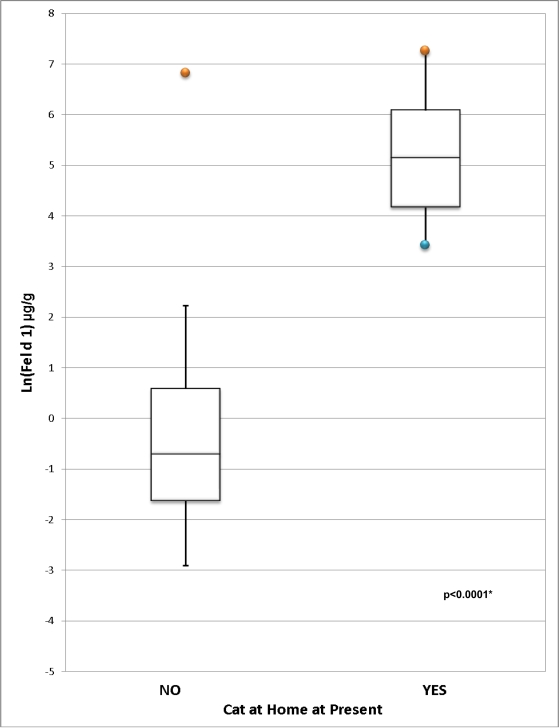
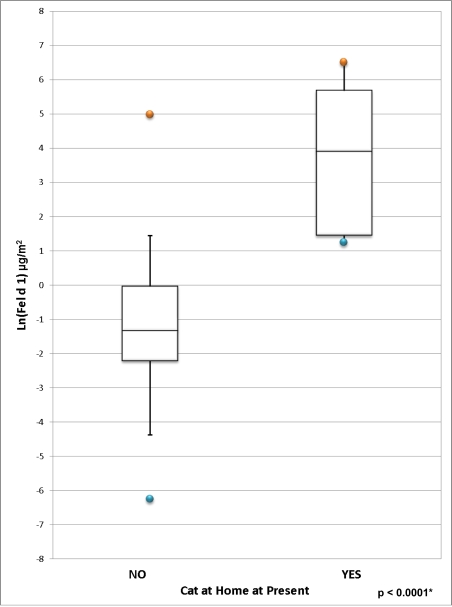
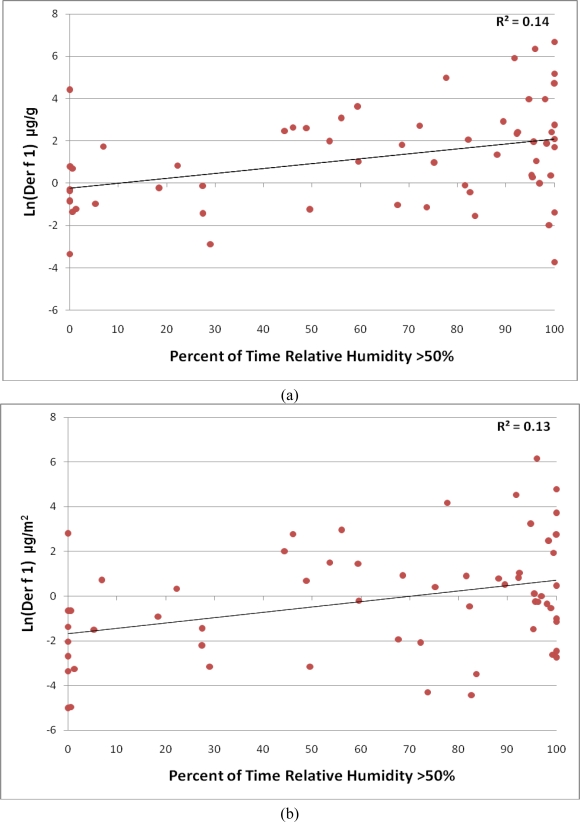
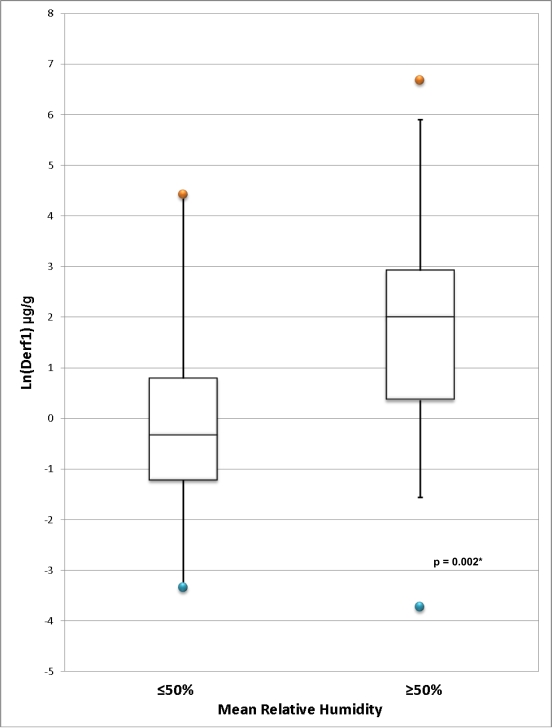
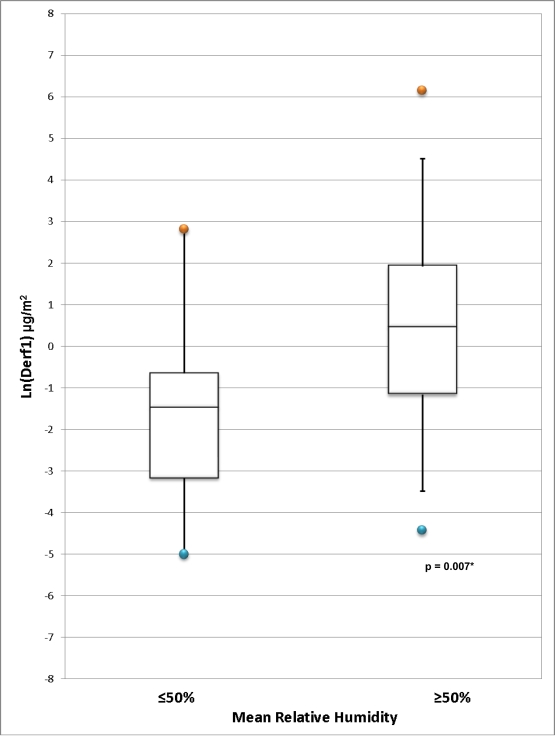
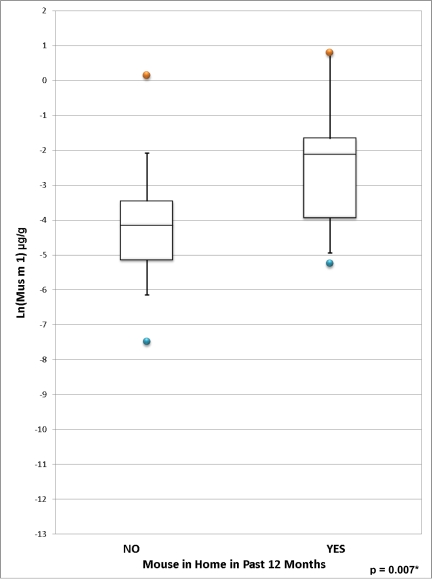
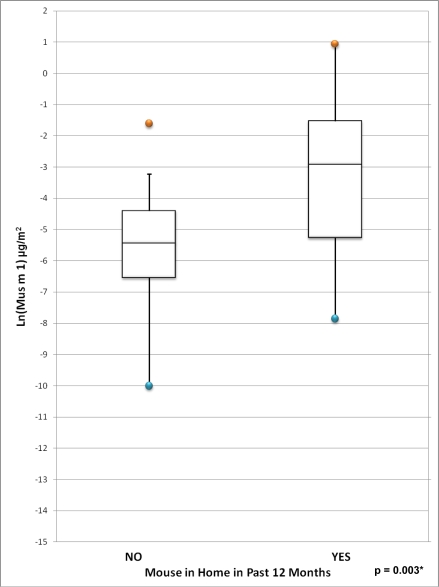
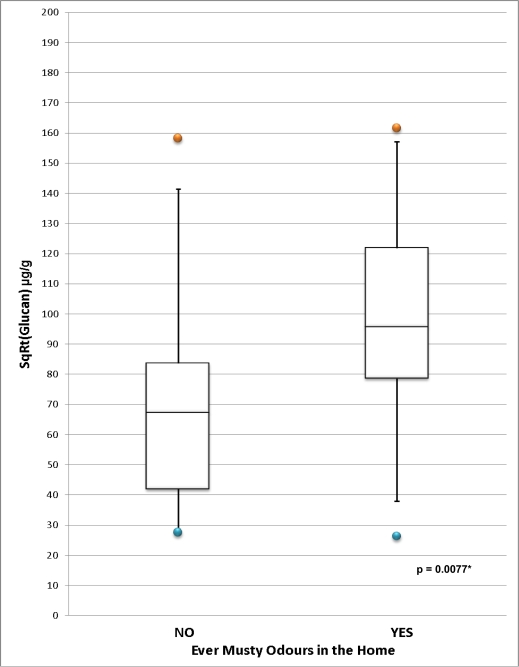
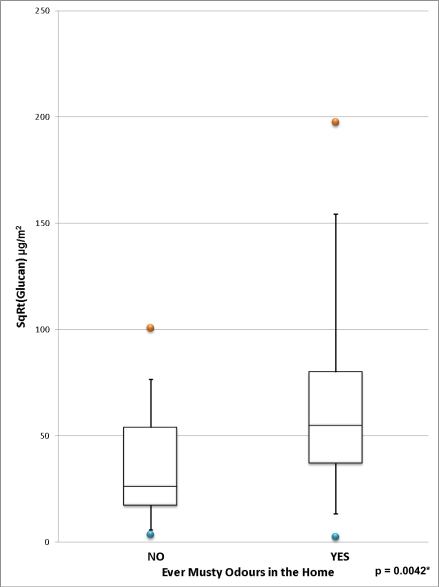
Home characteristic questions are used in epidemiological studies and clinical settings to assess potentially harmful exposures in the home. The objective of this study was to determine whether questionnaire-reported home characteristics can predict directly measured pollutants. Sixty home inspections were conducted on a subsample of the 2006 population-based Toronto Child Health Evaluation Questionnaire. Indoor/outdoor air and settled dust samples were analyzed. Mean Fel d 1 was higher (p < 0.0001) in homes with a cat (450.58 μg/g) versus without (22.28 μg/g). Mean indoor NO(2) was higher (p = 0.003) in homes with gas stoves (14.98 ppb) versus without (8.31 ppb). Self-reported musty odours predicted higher glucan levels (10554.37 μg/g versus 6308.58 μg/g, p = 0.0077). Der f 1 was predicted by the home's age, but not by reports of carpets, and was higher in homes with mean relative humidity > 50% (61.30 μg/g, versus 6.24 μg/g, p = 0.002). Self-reported presence of a cat, a gas stove, musty odours, mice, and the home's age and indoor relative humidity over 50% predicted measured indoor levels of cat allergens, NO(2), fungal glucan, mouse allergens and dust mite allergens, respectively. These results are helpful for understanding the significance of indoor exposures ascertained by self-reporting in large epidemiological studies and also in the clinical setting.

Keywords: allergens; environmental exposure; house dust; indoor air pollution; questionnaire.


Figures

Figure 1.
Figure 1.
Distribution of NO2 (ppb) comparing homes with and without gas stoves. *Two-sample t-test comparing Ln-transformed population means.
Figure 2.
Figure 2.
(a) Distribution of Ln-transformed Fel d 1 concentration (μg/g) in homes with and without cats. (b) Distribution of Ln-transformed Fel d 1 load (μg/m2) in homes with and without cats. *Two-sample t-test comparing Ln-transformed population means. (a) * Two-sample t-test comparing Ln-transformed population means. (b)
Figure 2.
Figure 2.
(a) Distribution of Ln-transformed Fel d 1 concentration (μg/g) in homes with and without cats. (b) Distribution of Ln-transformed Fel d 1 load (μg/m2) in homes with and without cats. *Two-sample t-test comparing Ln-transformed population means. (a) * Two-sample t-test comparing Ln-transformed population means. (b)
Figure 3.
Figure 3.
(a) Ln-transformed Der f 1 (μg/g) concentration by percent of time relative humidity exceeds 50%. (b) Ln-Transformed Der f 1 load (μg/m2) by percent of time relative humidity exceeds 50%.
Figure 4.
Figure 4.
(a) Distribution of Ln-transformed Der f 1 concentration (μg/g) in homes comparing mean relative humidity. (b) Distribution of Ln-Transformed Der f 1 load (μg/m2) in homes comparing mean relative humidity. *Two-sample t-test comparing Ln-transformed population means. (a) *Two-sample t-test comparing Ln-transformed population means. (b)
Figure 4.
Figure 4.
(a) Distribution of Ln-transformed Der f 1 concentration (μg/g) in homes comparing mean relative humidity. (b) Distribution of Ln-Transformed Der f 1 load (μg/m2) in homes comparing mean relative humidity. *Two-sample t-test comparing Ln-transformed population means. (a) *Two-sample t-test comparing Ln-transformed population means. (b)
Figure 5.
Figure 5.
(a) Distribution of Ln-transformed Mus m 1 concentration (μg/g) in homes with and without mice in the past 12 months. (b) Distribution of Ln-transformed Mus m 1 Load (μg/m2) in homes with and without mice in the past 12 months. *Two-sample t-test comparing Ln-transformed population means. (a) *Two-sample t-test comparing Ln-transformed population means. (b)
Figure 5.
Figure 5.
(a) Distribution of Ln-transformed Mus m 1 concentration (μg/g) in homes with and without mice in the past 12 months. (b) Distribution of Ln-transformed Mus m 1 Load (μg/m2) in homes with and without mice in the past 12 months. *Two-sample t-test comparing Ln-transformed population means. (a) *Two-sample t-test comparing Ln-transformed population means. (b)
Figure 6.
Figure 6.
(a) Distribution of Glucan Concentration (μg/g) in Homes Reporting and Not Reporting Musty Odours. (b) Distribution of Glucan Load (μg/m2) in Homes Reporting and Not Reporting Musty Odours. *Two-sample t-test comparing square root transformed population means. (a) *Two-sample t-test comparing square root transformed population means. (b)
Figure 6.
Figure 6.
(a) Distribution of Glucan Concentration (μg/g) in Homes Reporting and Not Reporting Musty Odours. (b) Distribution of Glucan Load (μg/m2) in Homes Reporting and Not Reporting Musty Odours. *Two-sample t-test comparing square root transformed population means. (a) *Two-sample t-test comparing square root transformed population means. (b)

Similar articles

Cited by

References

    1. Garner R, Kohen D. Changes in the prevalence of asthma among Canadian children. Health Rep. 2008;19:45–50. - PubMed
    1. Millar WJ, Hill GB. Childhood asthma. Health Rep. 1998;10:9–21. - PubMed
    1. Taylor WR, Newacheck PW. Impact of childhood asthma on health. Pediatrics. 1992;90:657–662. - PubMed
    1. Leech JA, Nelson WC, Burnett RT, Aaron S, Raizenne ME. It’s about time: A comparison of Canadian and American time-activity patterns. J. Expos. Anal. Environ. Epidemiol. 2002;12:427–432. - PubMed
    1. Meijer GG, van der Heide S, Postma DS, de Reus DM, Koeter GH, van Aalderen WM. House dust mite exposure in asthmatic and healthy children: The difference is carpeting. Pediatr. Allergy Immunol. 1995;6:187–191. - PubMed

Publication types