

Inside the outbreak of the 2009 influenza A (H1N1)v virus in Mexico
- PMID: 20949040
- PMCID: PMC2951908
- DOI: 10.1371/journal.pone.0013256
Inside the outbreak of the 2009 influenza A (H1N1)v virus in Mexico
Abstract
Background: Influenza viruses pose a threat to human health because of their potential to cause global disease. Between mid March and mid April a pandemic influenza A virus emerged in Mexico. This report details 202 cases of infection of humans with the 2009 influenza A virus (H1N1)v which occurred in Mexico City as well as the spread of the virus throughout the entire country.
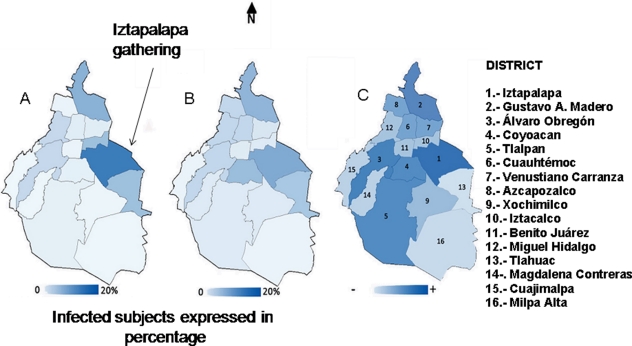
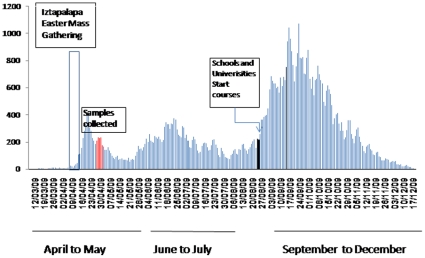
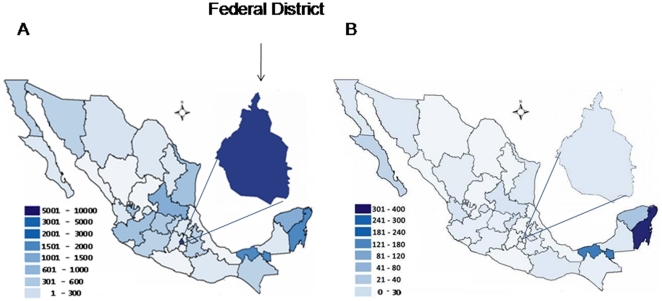
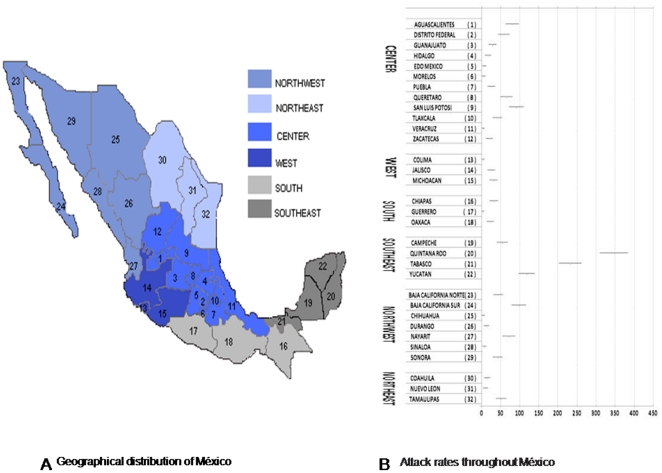
Methodology and findings: From May 1st to May 5th nasopharyngeal swabs, derived from 751 patients, were collected at 220 outpatient clinics and 28 hospitals distributed throughout Mexico City. Analysis of samples using real time RT-PCR revealed that 202 patients out of the 751 subjects (26.9%) were confirmed to be infected with the new virus. All confirmed cases of human infection with the strain influenza (H1N1)v suffered respiratory symptoms. The greatest number of confirmed cases during the outbreak of the 2009 influenza A (H1N1)v were seen in neighbourhoods on the northeast side of Mexico City including Iztapalapa, Gustavo A. Madero, Iztacalco, and Tlahuac which are the most populated areas in Mexico City. Using these data, together with data reported by the Mexican Secretariat of Health (MSH) to date, we plot the course of influenza (H1N1)v activity throughout Mexico.
Conclusions: Our data, which is backed up by MSH data, show that the greatest numbers of the 2009 influenza A (H1N1) cases were seen in the most populated areas. We speculate on conditions in Mexico which may have sparked this flu pandemic, the first in 41 years. We accept the hypothesis that high population density and a mass gathering which took in Iztapalapa contributed to the rapid spread of the disease which developed in three peaks of activity throughout the Country.
Conflict of interest statement
Figures
References
-
- Centers for disease control and prevention. Outbreak of swine-origin influenza A (H1N1) virus infection – Mexico, March–April 2009 (2009). MMWR Morb Mortal Wkly Rep MMWR Morb Mortal Wkly Rep. 2009;58:467–70. - PubMed
-
- Secretaría de salud. Situacion actual de la Pandemia. 2009. portal.salud.gob.mx/sites/salud/descargas/pdf/influenza/presentacion2009.... Accessed 28 January.
-
- Smith GJ, Vijaykrishna D, Bahl J, Lycett SJ, Worobey M, et al. Origins and evolutionary genomics of the 2009 swine-origin H1N1 influenza A epidemic. Nature. 2009;459:1122–1125. - PubMed
Publication types
MeSH terms
LinkOut - more resources
Full Text Sources
Medical
Miscellaneous
