. 2010 Nov;207(1-2):119-32.
doi: 10.1007/s00221-010-2440-y. Epub 2010 Oct 15.

Optimality vs. variability: an example of multi-finger redundant tasks

Affiliations

Optimality vs. variability: an example of multi-finger redundant tasks

Jaebum Park et al. Exp Brain Res. 2010 Nov.

Abstract

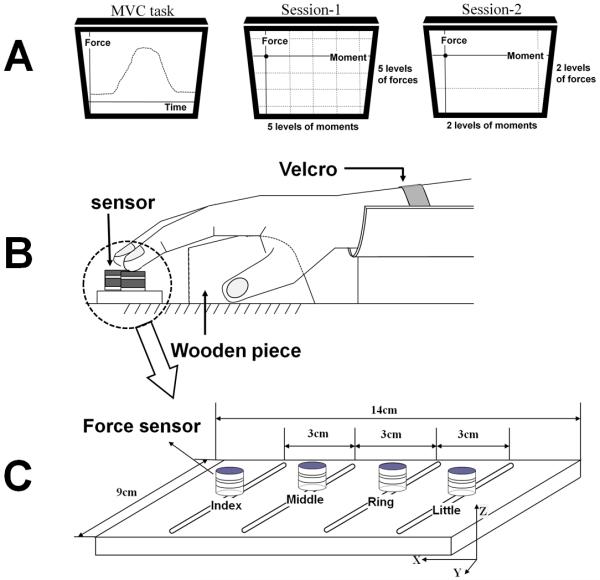
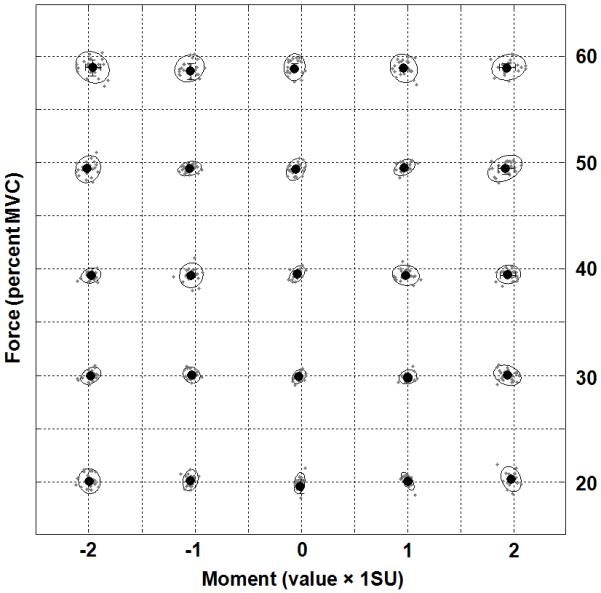
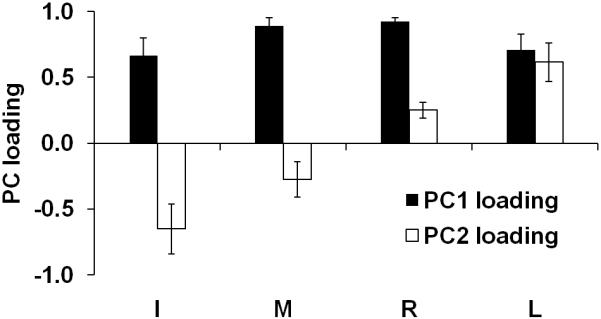
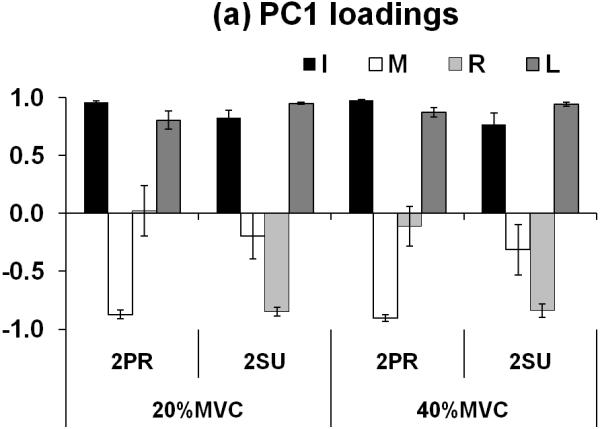
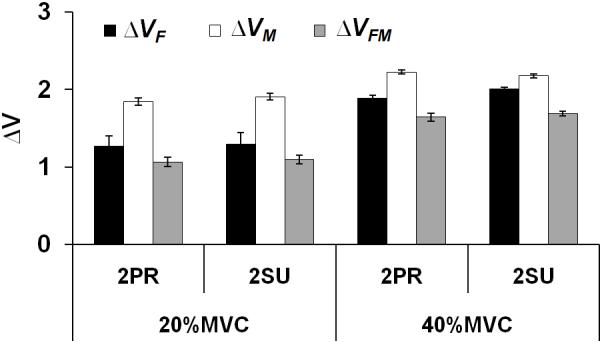
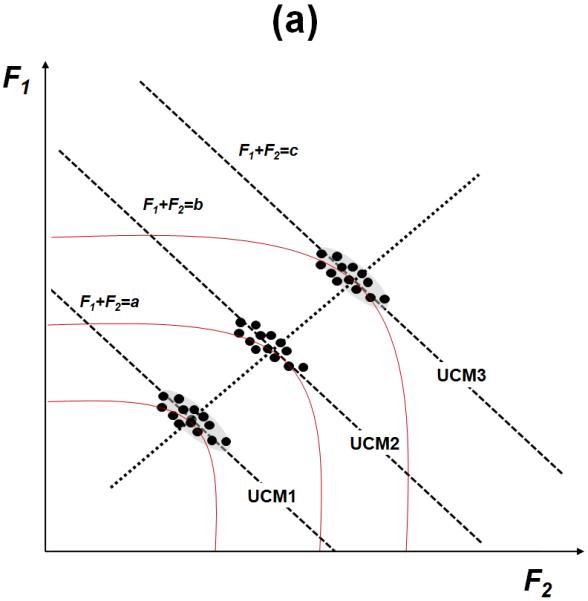
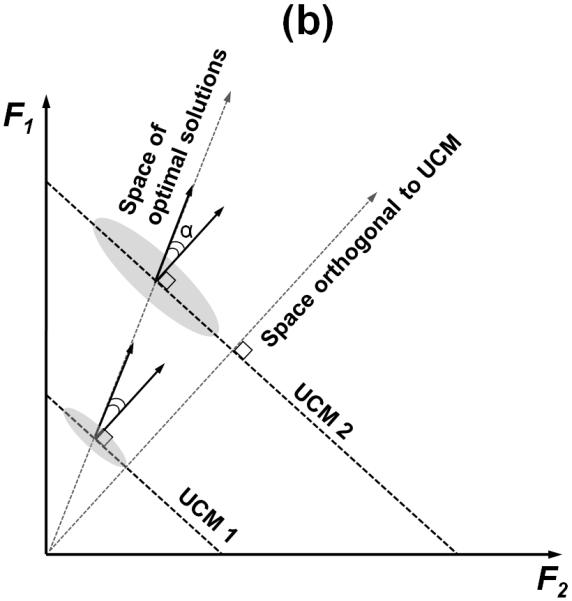
Two approaches to motor redundancy, optimization and the principle of abundance, seem incompatible. The former predicts a single, optimal solution for each task, while the latter assumes that families of equivalent solutions are used. We explored the two approaches using a four-finger pressing task with the requirement to produce certain combination of total normal force and a linear combination of normal forces that approximated the total moment of force in static conditions. In the first set of trials, many force-moment combinations were used. Principal component (PC) analysis showed that over 90% of finger force variance was accounted for by the first two PCs. The analytical inverse optimization (ANIO) approach was applied to these data resulting in quadratic cost functions with linear terms. Optimal solutions formed a hyperplane ("optimal plane") in the four-dimensional finger force space. In the second set of trials, only four force-moment combinations were used with multiple repetitions. Finger force variance within each force-moment combination in the second set was analyzed within the uncontrolled manifold (UCM) hypothesis. Most finger force variance was confined to a hyperplane (the UCM) compatible with the required force-moment values. We conclude that there is no absolute optimal behavior, and the ANIO yields the best fit to a family of optimal solutions that differ across trials. The difference in the force-producing capabilities of the fingers and in their moment arms may lead to deviations of the "optimal plane" from the subspace orthogonal to the UCM. We suggest that the ANIO and UCM approaches may be complementary in the analysis of motor variability in redundant systems.


Figures

Figure 1
Figure 1
A: The feedback during the MVC task, session-1 (5 levels of forces × 5 levels of moments), and session-2 (2 levels of forces × 2 levels of moments). B: The experimental setup. A wooden piece was placed underneath the subject’s right palm to ensure a constant configuration of the hand and fingers. C: The finger pressing setup. The sensors, shown as white cylinders, were attached to a wooden frame. The frame was fixed to the immovable table.
Figure 2
Figure 2
Normalized FTOT and MTOT data during session-1. Force values were normalized by MVCIMRL, and moment values were normalized by 1SU (see Methods). The large black dots indicate average values across subjects with standard deviations bars, while the small gray dots nested in the ellipses represent normalized force and moment values for individual subjects. The ellipses were fit to contain more than 90% of experimental observations for each condition.
Figure 3
Figure 3
The loading factors of PC1 and PC2 from session-1. The average PC loadings of individual finger forces are presented with standard error bars. I, M, R, and L indicate index, middle, ring, and little finger, respectively.
Figure 4
Figure 4
(a) Loading factors of PC1 and (b) of PC2 of individual finger forces for the four FTOT and MTOT combinations in session-2. The average PC loadings of individual fingers are presented with standard error bars. I, M, R, and L stand for index, middle, ring, and little finger, respectively
Figure 4
Figure 4
(a) Loading factors of PC1 and (b) of PC2 of individual finger forces for the four FTOT and MTOT combinations in session-2. The average PC loadings of individual fingers are presented with standard error bars. I, M, R, and L stand for index, middle, ring, and little finger, respectively
Figure 5
Figure 5
Two components of variance, VUCM and VORT, in the finger force space computed with respect to (a) FTOT, (b) MTOT, and (c) {FTOT, MTOT} as performance variables. Variances were normalized by degree-of-freedom of corresponding spaces. The average values (N2) across subjects are presented with standard error bars.
Figure 5
Figure 5
Two components of variance, VUCM and VORT, in the finger force space computed with respect to (a) FTOT, (b) MTOT, and (c) {FTOT, MTOT} as performance variables. Variances were normalized by degree-of-freedom of corresponding spaces. The average values (N2) across subjects are presented with standard error bars.
Figure 6
Figure 6
Z-transformed ΔV (dimensionless) for the FTOT-related (ΔVF), MTOT-related (ΔVM), and {FTOT, MTOT}-related (ΔVFM) analyses. Average ΔVZ across subjects are presented with standard error bars.
Figure 7
Figure 7
(a) Typical data distributions over repetitions of the task are shown for three values of the total force. The curves that touch each UCM in only one point, correspond to certain values of a hypothetical cost function. The dotted line indicates the optimal solution space. (b) An illustration of two uncontrolled manifolds (UCM1 and UCM2) for two values of the total force produced by two fingers. The two arrows indicate the space orthogonal to the UCM and the (hypothetical) space of optimal solutions. The gray ellipses show hypothetical data point distributions.
Figure 7
Figure 7
(a) Typical data distributions over repetitions of the task are shown for three values of the total force. The curves that touch each UCM in only one point, correspond to certain values of a hypothetical cost function. The dotted line indicates the optimal solution space. (b) An illustration of two uncontrolled manifolds (UCM1 and UCM2) for two values of the total force produced by two fingers. The two arrows indicate the space orthogonal to the UCM and the (hypothetical) space of optimal solutions. The gray ellipses show hypothetical data point distributions.

References

    1. Ait-Haddou R, Jinha A, Herzog W, Binding P. Analysis of the force-sharing problem using an optimization model. Math Biosci. 2004;191:111–122. - PubMed
    1. Bernstein NA. The co-ordination and regulation of movements. Pergamon Press; Oxford: 1967.
    1. Bottasso CL, Prilutsky BI, Croce A, Imberti E, Sartirana S. A numerical procedure for inferring from experimental data the optimization cost functions using a multibody model of the neuro-musculoskeletal system. Multibody Syst Dyn. 2006;16:123–154.
    1. Feldman AG. Once more on the equilibrium-point hypothesis (lambda model) for motor control. J Mot Behav. 1986;18:17–54. - PubMed
    1. Feldman AG, Levin MF. The origin and use of positional frames of reference in motor control. Behav Brain Sci. 1995;18:723–806.

Publication types

LinkOut - more resources