Randomized Controlled Trial
. 2011 Oct;17(5):311-26.
doi: 10.1111/j.1755-5949.2010.00190.x. Epub 2010 Oct 15.

Beneficial effects of electrostimulation contingencies on sustained attention and electrocortical activity

Affiliations
Randomized Controlled Trial

Beneficial effects of electrostimulation contingencies on sustained attention and electrocortical activity

Max Jean-Lon Chen et al. CNS Neurosci Ther. 2011 Oct.

Abstract

Introduction: Chinese acupuncture therapy has been practiced for more than 3000 years. According to neuroimaging studies, electroacupuncture has been demonstrated to be effective via control of the frequency parameter of stimulation, based on the theory of frequency modulation of brain function.

Aims: To investigate the following: (1) possible sustained effects of acustimulation in improving perceptual sensitivity in attention by comparing before, during, and 5 min following stimulation; (2) relations between commission errors and the motor inhibition event-related potential (ERP) component measured with independent component analysis (ICA); (3) whether habituation would be demonstrated in the sham control group and would be militated by acustimulation in the experimental groups.

Results: Twenty-seven subjects were divided into three groups (n = 9). d-Prime (d') derived from signal detection theory was used as an index of perceptual sensitivity in the visual continuous performance attention test. Increased d' was found during both alternating frequency (AE) and low frequency (LE) stimulation, but with no change in the sham control group (SE). However, only following AE was there a sustained poststimulation effect. Spatial filtration-based independent components (ICs) in the AE group revealed significantly decreased amplitudes of the motor inhibition ICs both during and poststimulation. There was a significant habituation effect from task repetition in the sham group with decreased amplitudes of ICs as follows: the visual comparison component difference between go (correct response) and nogo cues (correct withheld response), the P400 action monitoring and the working memory component in the nogo condition, and the passive auditory component on control trials.

Conclusion: The results showed associations between acustimulation and improved perceptual sensitivity with sustained improvements following AE, but not LE stimulation. Improvements in commission errors in the AE group were related to the motor inhibition IC. The activational effects of acustimulation apparently attenuated the across-task habituation that characterized the control group.


Conflict of interest statement

The authors have no conflict of interest.

Figures

Figure 1
Figure 1
The location of two acupoints. (A) HeGu, (B) NeiGuan, and (C) the application of the stimulator device on both acupoints.
Figure 2
Figure 2
Stimulus presentation in the visual attention task: (1) prestimulus interval, (2) first stimulus, (3) interstimulus interval, (4) second stimulus, (5) poststimulus interval, (6) subject response. Two arrows and lines represent the continuous time axis during the task with four pairs of pictures randomly shown. The first pair, the Animal‐Animal (A‐A) pair, represents the “go” cue, to which the subject should press the button. The second pair, the Animal‐Plant (A‐P) pair, represents a “nogo” cue, and the subject should not respond. The remaining two Plant‐Plant (P‐P) and Plant‐Human (P‐H) pairs are control condition trials, and the subject should ignore them.
Figure 3
Figure 3
Electrostimulation changes on mean d′ scores (± SEM) in the attention task for both AE and LE groups relative to the SE control group (★ denotes P < 0.05; AE, alternating frequency; LE, low frequency; SE, sham electrostimulation; t1, the contrast test during vs. before stimulation in the AE group; t2, the contrast test after vs. before stimulation in the AE group; ns, not significant during vs. after stimulation in the AE group; t3, the contrast test during vs. before LE stimulation; t4, after vs. during LE stimulation; t5, before vs. after LE stimulation, ns, not significant).
Figure 4
Figure 4
Electrostimulation changes on mean commission errors (± SEM) in the attention task for both AE and LE groups relative to the SE control group (★ denotes P < 0.05; t1, the contrast test during vs. before stimulation in the AE group; t2, the contrast test after vs. before stimulation in the AE group; t3, the contrast test during vs. before LE stimulation; t4, after vs. before LE stimulation; t5, after vs. before SE stimulation).
Figure 5
Figure 5
Postelectrostimulation changes on mean response times (± SEM) in the attention task for the AE, LE, and SE control groups (★ denotes P < 0.05; RT, response time).
Figure 6
Figure 6
Grand average ERPs for each group and time block for the midline electrodes in the attention paradigm. A frontally distributed negative ERP component had greater amplitude for nogo in comparison to go stimuli and was associated with response inhibition in go‐nogo paradigms (upper panel). No significant changes in amplitudes and latencies among three groups and three time periods (before, during, and after stimulation) were found. (See also Table 3.)
Figure 7
Figure 7
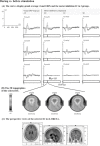
(A) Grand mean extracted motor inhibition ICs at midline scalp sites and correlated ERP of nogo‐go cues, during stimulation (blue lines) compared with prestimulation (red lines) in the three groups. Red lines showed the prestimulation baseline of grand mean ERPs and grand mean motor inhibition components in the three groups. The animal pairs were the targets of the manual responses (GO cues), and nogo‐go means the component difference between go and nogo cues. Superimposed blue lines gave the grand mean ERPs and grand mean motor inhibition components during electrostimulation in the three groups. (B) Horizontal bars below each trace represent t‐test results from 0–1500 ms after the second stimulus onset, with values P < 0.05 represented in gray between 372 and 396 ms, to illustrate the time course of significant differences from the baseline in the 2D scalp maps. (C) The perspective views (top, sagittal, and coronal views) showed the highest density of the motor inhibition component, according to sLORETA images for cortical generators.
Figure 8
Figure 8
(A) Grand mean extracted motor inhibition ICs at midline scalp sites and correlated ERP of nogo‐go cues, after stimulation (blue lines) compared with prestimulation (red lines) in the three groups. Layout as for Figure 7(A)–(C).
Figure 9
Figure 9
The independent components difference between the first and third task repetition in the sham stimulation group. (A) The visual comparison component difference between go and nogo cues. (B) The P400 action monitoring component in the nogo condition. The upper row of the panel for each component shows the grand mean component in amplitude‐time plot at Cz (upper left), the scalp topographic map (upper middle), and the single equivalent current dipole locations for each component (upper right). The lower row shows the highest density of each component, according to sLORETA images, from three different perspectives (top, sagittal and coronal views). Each red line shows the grand mean component of the first attention task. Each superimposed blue line gives the grand mean component of the repeated third task. Horizontal bars below each trace represent t‐test results from 0–1500 ms post second stimulus onset, with values P < 0.05 represented in gray, to illustrate the time course of significant differences between the first and the third repeated tasks.
Figure 10
Figure 10
The independent components difference between the first and third task repetition in the sham stimulation group. (A) The P400 working memory component in both the go and nogo conditions. (B) The passive auditory P300 component in the control condition. Same layout as for the panels in Figure 9(A) and (B) with values P < 0.05 and P < 0.01 represented in gray and black, to illustrate the time course of significant differences between the first and the third repeated tasks.

References

    1. Han JS. Acupuncture and endorphins. Neurosci Lett 2004;361:258–261. - PubMed
    1. He D, Veiersted KB, Hostmark AT, Medbo JI. Effect of acupuncture treatment on chronic neck and shoulder pain in sedentary female workers: A 6‐month and 3‐year follow‐up study. Pain 2004;109:299–307. - PubMed
    1. Huang C, Wang Y, Han JS, Wan Y. Characteristics of electroacupuncture‐induced analgesia in mice: Variation with strain, frequency, intensity and opioid involvement. Brain Res 2002;945:20–25. - PubMed
    1. Wong AM, Su TY, Tang FT, Cheng PT, Liaw MY. Clinical trial of electrical acupuncture on hemiplegic stroke patients. Am J Phys Med Rehabil 1999;78:117–122. - PubMed
    1. Berman BM. Seminal studies in acupuncture research. J Altern Complement Med 2001;7(Suppl):S129–S137. - PubMed

Publication types