. 2010 Oct 15:11:516.
doi: 10.1186/1471-2105-11-516.

QTLminer: identifying genes regulating quantitative traits

Affiliations

QTLminer: identifying genes regulating quantitative traits

Rudi Alberts et al. BMC Bioinformatics. .

Abstract

Background: Quantitative trait locus (QTL) mapping identifies genomic regions that likely contain genes regulating a quantitative trait. However, QTL regions may encompass tens to hundreds of genes. To find the most promising candidate genes that regulate the trait, the biologist typically collects information from multiple resources about the genes in the QTL interval. This process is very laborious and time consuming.

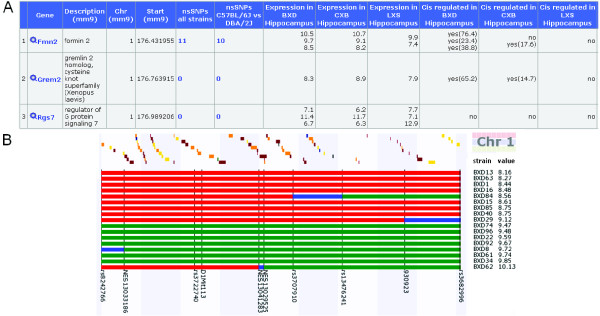
Results: QTLminer is a bioinformatics tool that automatically performs QTL region analysis. It is available in GeneNetwork and it integrates information such as gene annotation, gene expression and sequence polymorphisms for all the genes within a given genomic interval.

Conclusions: QTLminer substantially speeds up discovery of the most promising candidate genes within a QTL region.


Figures

Figure 1
Figure 1
QTLminer results and haplotype visualization. A) Part of the results returned by QTLminer. The genes in the QTL interval and their descriptions and positions are presented. Next, the amount of non-synonymous SNPs within all available mouse strains is given, and the amount of nsSNPs between two chosen strains, in this case C57BL/6J and DBA/2J. The expression columns display the mean expression values within three GeneNetwork data sets. Note that multiple values per gene are given when the gene is measured by multiple probes. The next columns show cis-regulation. If a gene is cis-regulated, the LRS value (likely ratio statistic) that indicates the significance of the cis QTL is also given. B) Haplotype visualization of BXD mice for the Qrr1 region. A red (green) line indicates that the mouse carries the C57BL/6J (DBA/2J) genotype. The vertical lines are existing genotypic data and colored lines in between are inferred genotypes based on the mapping of surrounding markers. Blue lines indicate a region containing a recombination break point. Strains are ordered according to trait value. Genes in the interval are displayed at the top (colored bars).

References

    1. Brem RB, Yvert G, Clinton R, Kruglyak L. Genetic dissection of transcriptional regulation in budding yeast. Science. 2002;296:752–755. doi: 10.1126/science.1069516. - DOI - PubMed
    1. Bystrykh L, Weersing E, Dontje B, Sutton S, Pletcher MT, Wiltshire T, Su AI, Vellenga E, Wang J, Manly KF, Lu L, Chesler EJ, Alberts R, Jansen RC, Williams RW, Cooke MP, de Haan G. Uncovering regulatory pathways that affect hematopoietic stem cell function using 'genetical genomics'. Nat Genet. 2005;37:225–232. doi: 10.1038/ng1497. - DOI - PubMed
    1. Foss EJ, Radulovic D, Shaffer SA, Ruderfer DM, Bedalov A, Goodlett DR, Kruglyak L. Genetic basis of proteome variation in yeast. Nat Genet. 2007;39:1369–1375. doi: 10.1038/ng.2007.22. - DOI - PubMed
    1. Keurentjes JJ, Fu J, de Vos CH, Lommen A, Hall RD, Bino RJ, van der Plas LH, Jansen RC, Vreugdenhil D, Koornneef M. The genetics of plant metabolism. Nat Genet. 2006;38:842–849. doi: 10.1038/ng1815. - DOI - PubMed
    1. GeneNetwork. http://genenetwork.helmholtz-hzi.de

Publication types

LinkOut - more resources