. 2011 Jan;140(1):210-20.
doi: 10.1053/j.gastro.2010.09.048. Epub 2010 Oct 13.

Lack of commensal flora in Helicobacter pylori-infected INS-GAS mice reduces gastritis and delays intraepithelial neoplasia

Affiliations

Lack of commensal flora in Helicobacter pylori-infected INS-GAS mice reduces gastritis and delays intraepithelial neoplasia

Jennifer L Lofgren et al. Gastroenterology. 2011 Jan.

Abstract

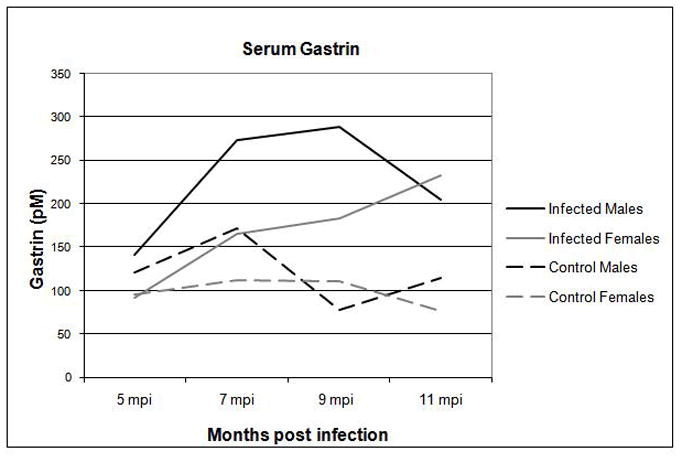
Background & aims: Transgenic FVB/N insulin-gastrin (INS-GAS) mice have high circulating gastrin levels, and develop spontaneous atrophic gastritis and gastrointestinal intraepithelial neoplasia (GIN) with 80% prevalence 6 months after Helicobacter pylori infection. GIN is associated with gastric atrophy and achlorhydria, predisposing mice to nonhelicobacter microbiota overgrowth. We determined if germfree INS-GAS mice spontaneously develop GIN and if H pylori accelerates GIN in gnotobiotic INS-GAS mice.

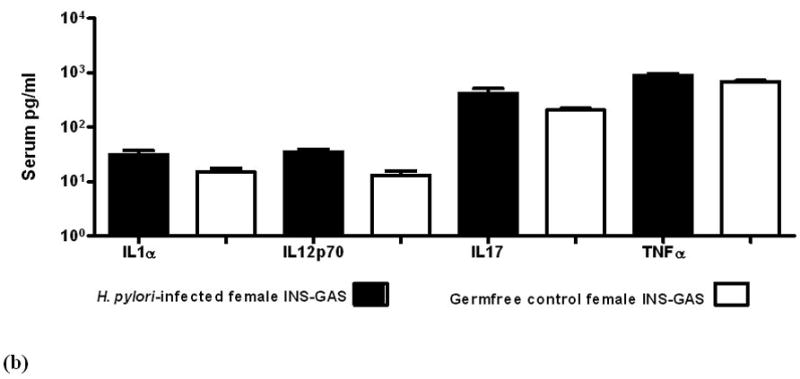
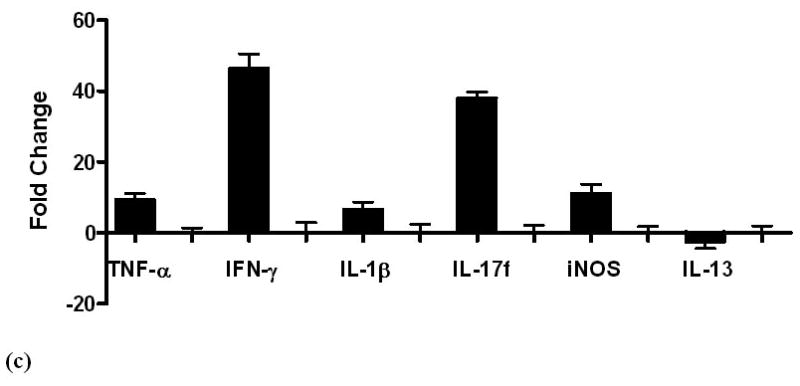
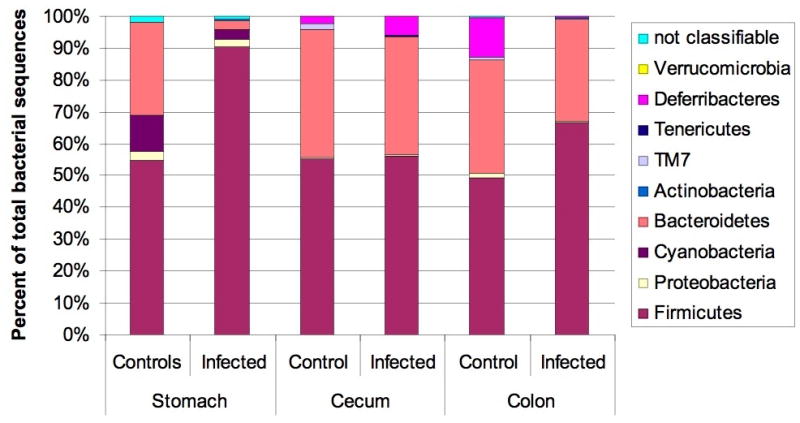
Methods: We compared gastric lesions, levels of messenger RNA, serum inflammatory mediators, antibodies, and gastrin among germfree and H pylori-monoinfected INS-GAS mice. Microbiota composition of specific pathogen-free (SPF) INS-GAS mice was quantified by pyrosequencing.

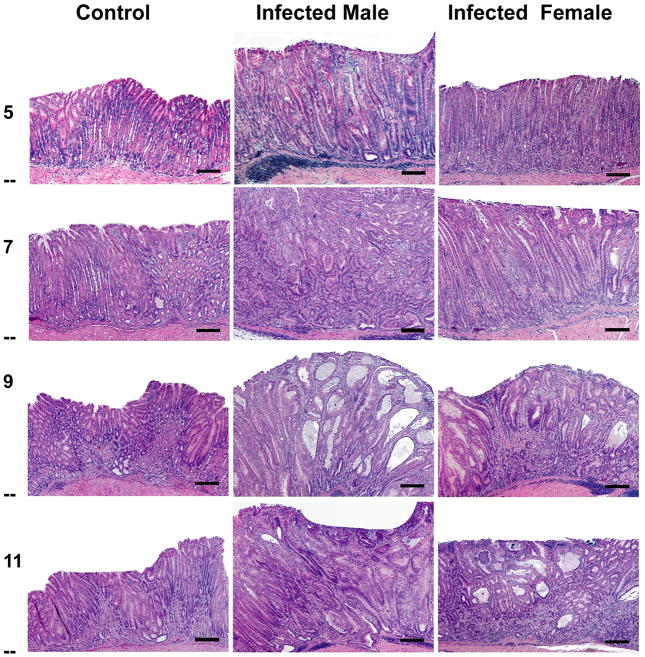
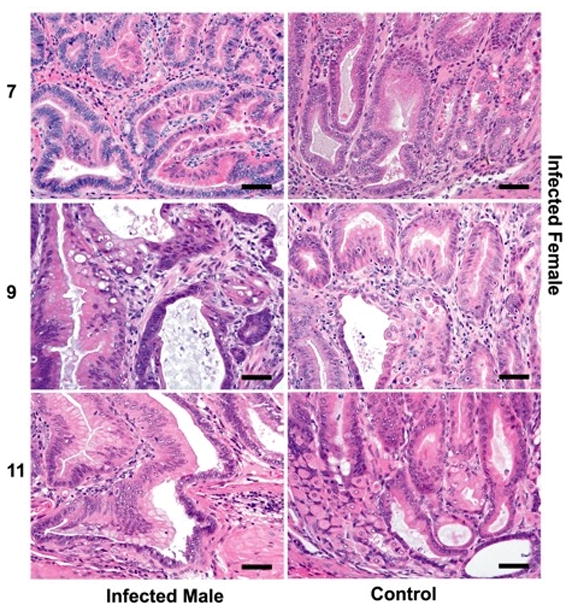
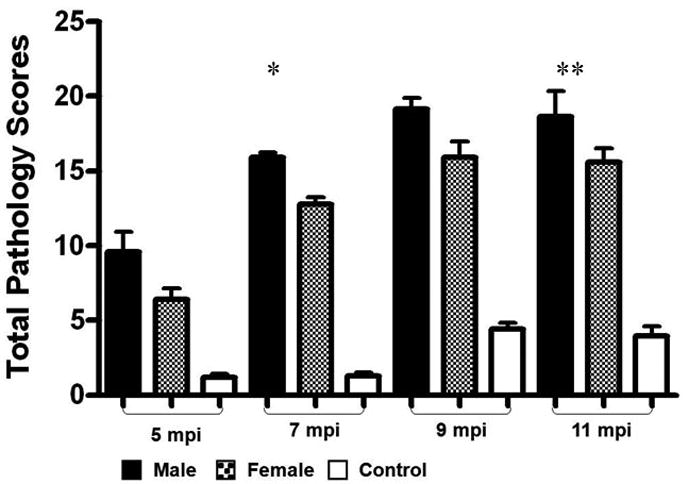
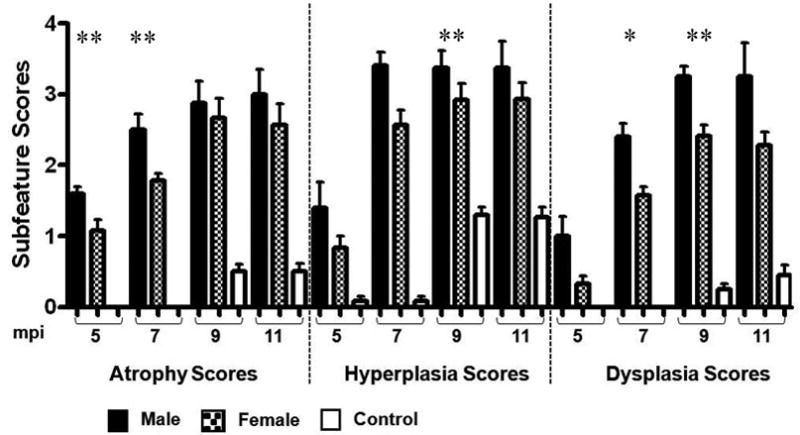
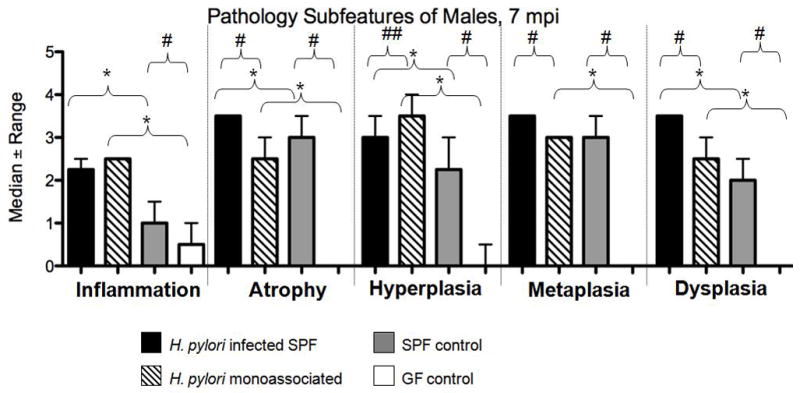
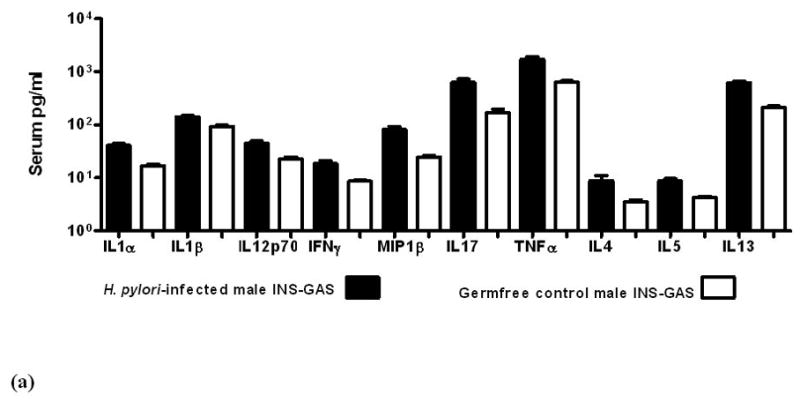
Results: Germfree INS-GAS mice had mild hypergastrinemia but did not develop significant gastric lesions until 9 months old and did not develop GIN through 13 months. H pylori monoassociation caused progressive gastritis, epithelial defects, oxyntic atrophy, marked foveolar hyperplasia, dysplasia, and robust serum and tissue proinflammatory immune responses (particularly males) between 5 and 11 months postinfection (P<0.05, compared with germfree controls). Only 2 of 26 female, whereas 8 of 18 male, H pylori-infected INS-GAS mice developed low to high-grade GIN by 11 months postinfection. Stomachs of H pylori-infected SPF male mice had significant reductions in Bacteroidetes and significant increases in Firmicutes.

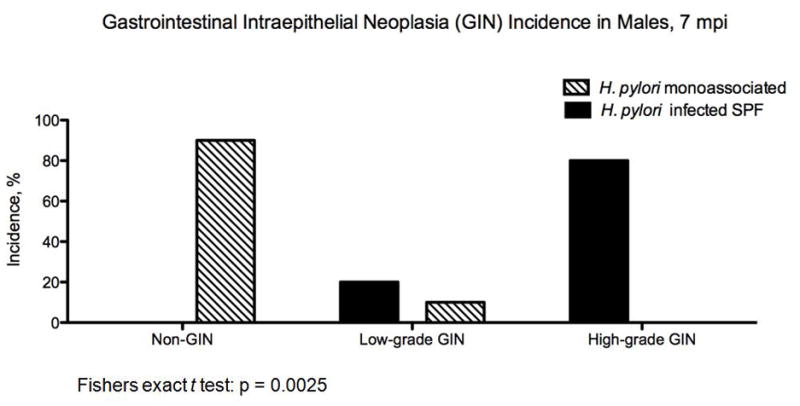
Conclusions: Gastric lesions take 13 months longer to develop in germfree INS-GAS mice than male SPF INS-GAS mice. H pylori monoassociation accelerated gastritis and GIN but caused less severe gastric lesions and delayed onset of GIN compared with H pylori-infected INS-GAS mice with complex gastric microbiota. Changes in gastric microbiota composition might promote GIN in achlorhydric stomachs of SPF mice.


Figures

Figure 1
Figure 1
Serum gastrin levels were higher in H. pylori-infected male and female INS-GAS mice compared to GF controls at 5, 7, 9, and 11 mpi. * p < 0.05 – significant differences between H. pylori-monoassociated and GF control mice. # p < 0.05 – significant differences between H. pylori-monoassociated male and female mice.
Figure 2
Figure 2
(a) Gastric lesions in H. pylori-monoassociated (male and female) and GF control (male) mice at 5, 7, 9 and 11 mpi. Control GF INS-GAS mice did not develop significant gastric lesions until the 7 mpi timepoint and no GIN was observed through 11 mpi. In contrast H. pylori monoassociation caused progressive gastritis, epithelial defects, oxyntic gland atrophy with metaplasia, marked foveolar hyperplasia and dysplasia, particularly in male INS-GAS mice, between 5 and 11 mpi (p<0.05). Two of 26 female, whereas 8 of 18 male, H. pylori-monoassociated INS-GAS mice developed low to high grade GIN during the 11 mpi observation period. Bars = 200μ for 5 and 7 mpi; 400μ for 9 and 11 mpi. (b) Corresponding higher magnification images (a) highlighting gastric metaplastic and dysplastic changes in H. pylori-monoassociated and control INS-GAS. (All Bars = 40μM). Top left, Male, 7 mpi: Loss of oxyntic glands from glandular metaplasia (pseudopyloric), mild to moderate dysplasia characterized by glandular architectural distortion, loss of columnar orientation, papillary infolding, nuclear stratification and mild nuclear atypia. Top right, Female, 7 mpi: Oxyntic loss, glandular metaplasia globoid mucous change, mild dysplasia characterized by glandular elongation and coiling. Center left, Male, 9 mpi: Glandular metaplasia, moderate to severe dysplasia characterized by severe architectural distortion, glandular ectasia, infolding, disorganized nuclear stratification, cytoplasmic mucous globules and nuclear margination (globoid dysplasia), sloughing of cells and mucous into the glandular lumen. Additionally, loss of basement membranes from dysplastic glands with rafts, finger–like extensions or single polygonal cells in the lamina propria and mild reactive fibrosis indicative of lamina propria invasion. Right center, Female, 9 mpi: Glandular metaplasia, loss of columnar orientation, architectural distortion, infolding, nuclear stratification and nuclear atypia. Bottom left, Male, 11 mpi: Glandular metaplasia, prominent globoid dysplasia, breaching of muscularis mucosa and herniation of dysplastic gland into submucosa. Bottom right, Uninfected Male, 11 mpi: Metaplasia of some oxyntic glands, occasional mild glandular distortion, luminal distension and loss of columnar orientation.
Figure 2
Figure 2
(a) Gastric lesions in H. pylori-monoassociated (male and female) and GF control (male) mice at 5, 7, 9 and 11 mpi. Control GF INS-GAS mice did not develop significant gastric lesions until the 7 mpi timepoint and no GIN was observed through 11 mpi. In contrast H. pylori monoassociation caused progressive gastritis, epithelial defects, oxyntic gland atrophy with metaplasia, marked foveolar hyperplasia and dysplasia, particularly in male INS-GAS mice, between 5 and 11 mpi (p<0.05). Two of 26 female, whereas 8 of 18 male, H. pylori-monoassociated INS-GAS mice developed low to high grade GIN during the 11 mpi observation period. Bars = 200μ for 5 and 7 mpi; 400μ for 9 and 11 mpi. (b) Corresponding higher magnification images (a) highlighting gastric metaplastic and dysplastic changes in H. pylori-monoassociated and control INS-GAS. (All Bars = 40μM). Top left, Male, 7 mpi: Loss of oxyntic glands from glandular metaplasia (pseudopyloric), mild to moderate dysplasia characterized by glandular architectural distortion, loss of columnar orientation, papillary infolding, nuclear stratification and mild nuclear atypia. Top right, Female, 7 mpi: Oxyntic loss, glandular metaplasia globoid mucous change, mild dysplasia characterized by glandular elongation and coiling. Center left, Male, 9 mpi: Glandular metaplasia, moderate to severe dysplasia characterized by severe architectural distortion, glandular ectasia, infolding, disorganized nuclear stratification, cytoplasmic mucous globules and nuclear margination (globoid dysplasia), sloughing of cells and mucous into the glandular lumen. Additionally, loss of basement membranes from dysplastic glands with rafts, finger–like extensions or single polygonal cells in the lamina propria and mild reactive fibrosis indicative of lamina propria invasion. Right center, Female, 9 mpi: Glandular metaplasia, loss of columnar orientation, architectural distortion, infolding, nuclear stratification and nuclear atypia. Bottom left, Male, 11 mpi: Glandular metaplasia, prominent globoid dysplasia, breaching of muscularis mucosa and herniation of dysplastic gland into submucosa. Bottom right, Uninfected Male, 11 mpi: Metaplasia of some oxyntic glands, occasional mild glandular distortion, luminal distension and loss of columnar orientation.
Figure 3
Figure 3
Total pathology scores and subfeature scores of categorical lesions were significantly increased in H. pylori-monoassociated mice compared to GF controls (p values ranging from <0.05 to <0.01) and were more severe in H. pylori-monoassociated INS-GAS male mice compared to females at 5, 7, 9, and 11 mpi. * p < 0.01 – Significant differences between H. pylori- monoassociated male and female mice. ** p < 0.05 – Significant differences between H. pylori- monoassociated male and female mice.
Figure 3
Figure 3
Total pathology scores and subfeature scores of categorical lesions were significantly increased in H. pylori-monoassociated mice compared to GF controls (p values ranging from <0.05 to <0.01) and were more severe in H. pylori-monoassociated INS-GAS male mice compared to females at 5, 7, 9, and 11 mpi. * p < 0.01 – Significant differences between H. pylori- monoassociated male and female mice. ** p < 0.05 – Significant differences between H. pylori- monoassociated male and female mice.
Figure 4
Figure 4
(a) Subfeature pathology scores of categorical lesions and incidence of GIN were significantly increased in H. pylori-infected SPF male mice at 7 mpi compared to H. pylori-monoassociated males at 7 mpi and in the SPF control males compared to the GF control males at 7 mpi (p values ranging from <0.01 <0.05). (b) Development of GIN was significantly increased in H. pylori-infected SPF male mice at 7 mpi compared to H. pylori-monoassociated males at 7mpi (Fishers exact t test: p = 0.0025). *p ≤ 0.01- Significant differences between H. pylori monoassociated mice and GF control mice or between H. pylori infected SPF mice and SPF control mice. # p ≤ 0.01, ## p ≤ 0.05 - Significant differences between H. pylori infected SPF mice and H. pylori-monoassociated mice or between SPF control mice and GF control mice.
Figure 4
Figure 4
(a) Subfeature pathology scores of categorical lesions and incidence of GIN were significantly increased in H. pylori-infected SPF male mice at 7 mpi compared to H. pylori-monoassociated males at 7 mpi and in the SPF control males compared to the GF control males at 7 mpi (p values ranging from <0.01 <0.05). (b) Development of GIN was significantly increased in H. pylori-infected SPF male mice at 7 mpi compared to H. pylori-monoassociated males at 7mpi (Fishers exact t test: p = 0.0025). *p ≤ 0.01- Significant differences between H. pylori monoassociated mice and GF control mice or between H. pylori infected SPF mice and SPF control mice. # p ≤ 0.01, ## p ≤ 0.05 - Significant differences between H. pylori infected SPF mice and H. pylori-monoassociated mice or between SPF control mice and GF control mice.
Figure 5
Figure 5
Serum levels of cytokines and chemokines in GF control and H. pylori-monoassociated (a) male INS-GAS mice at 9 mpi and in (b) comparable groups of females at 11 mpi. Within each gender, all differences between infected and GF control mice were significant (males, p<0.02; females p<0.04). (c) Fold-change of mRNA expression levels in gastric tissue from H. pylori-monoassociated INS-GAS mice (gender data combined) at 9 mpi when gastric lesions were most severe. Fold-change represents comparison to baseline levels pre-set for gastric tissues from control GF mice. There were no gender differences (not shown) and all differences between expression levels of H. pylori-monoassociated and GF control mice were significant (p<0.01, all but IL-13; p<0.04 for IL-13). Error bars for panels (a), (b) and (c) represent standard deviation.
Figure 5
Figure 5
Serum levels of cytokines and chemokines in GF control and H. pylori-monoassociated (a) male INS-GAS mice at 9 mpi and in (b) comparable groups of females at 11 mpi. Within each gender, all differences between infected and GF control mice were significant (males, p<0.02; females p<0.04). (c) Fold-change of mRNA expression levels in gastric tissue from H. pylori-monoassociated INS-GAS mice (gender data combined) at 9 mpi when gastric lesions were most severe. Fold-change represents comparison to baseline levels pre-set for gastric tissues from control GF mice. There were no gender differences (not shown) and all differences between expression levels of H. pylori-monoassociated and GF control mice were significant (p<0.01, all but IL-13; p<0.04 for IL-13). Error bars for panels (a), (b) and (c) represent standard deviation.
Figure 6
Figure 6
Microbiota composition in stomach, cecum and colon of H. pylori infected male INS-GAS mice (n=3, 15 wpi) vs. uninfected controls (n=2). Note the significant increase in the relative abundance of Firmicutes and decrease of Bacteroidetes in the stomachs of H. pylori infected mice (p<0.05), while no significant changes were observed in the other parts of the gastrointestinal tract.

References

    1. Fox JG, Wang TC. Inflammation, atrophy, and gastric cancer. J Clin Invest. 2007;117:60–69. - PMC - PubMed
    1. Brenner H, Rothenbacher D, Arndt V. Epidemiology of stomach cancer. Methods Mol Biol. 2009;472:467–477. - PubMed
    1. Bruce MG, Maaroos HI. Epidemiology of Helicobacter pylori infection. Helicobacter. 2008;13 (Suppl 1):1–6. - PubMed
    1. Whary MT, Sundina N, Bravo LE, et al. Intestinal helminthiasis in Colombian children promotes a Th2 response to Helicobacter pylori: possible implications for gastric carcinogenesis. Cancer Epidemiol Biomarkers Prev. 2005;14:1464–1469. - PubMed
    1. Fox JG, Li X, Cahill RJ, et al. Hypertrophic gastropathy in Helicobacter felis-infected wild-type C57BL/6 mice and p53 hemizygous transgenic mice. Gastroenterology. 1996;110:155–166. - PubMed

Publication types

MeSH terms