

In vivo mapping of brain myo-inositol
- PMID: 20951217
- PMCID: PMC3013615
- DOI: 10.1016/j.neuroimage.2010.10.017
In vivo mapping of brain myo-inositol
Abstract
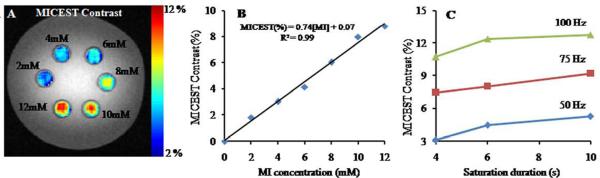
Myo-Inositol (MI) is one of the most abundant metabolites in the human brain located mainly in glial cells and functions as an osmolyte. The concentration of MI is altered in many brain disorders including Alzheimer's disease and brain tumors. Currently available magnetic resonance spectroscopy (MRS) methods for measuring MI are limited to low spatial resolution. Here, we demonstrate that the hydroxyl protons on MI exhibit chemical exchange with bulk water and saturation of these protons leads to reduction in bulk water signal through a mechanism known as chemical exchange saturation transfer (CEST). The hydroxyl proton exchange rate (k=600 s(-1)) is determined to be in the slow to intermediate exchange regime on the NMR time scale (chemical shift (∆ω)>k), suggesting that the CEST effect of MI (MICEST) can be imaged at high fields such as 7 T (∆ω=1.2×10(3)rad/s) and 9.4 T (∆ω=1.6×10(3) rad/s). Using optimized imaging parameters, concentration dependent broad CEST asymmetry between ~0.2 and 1.5 ppm with a peak at ~0.6 ppm from bulk water was observed. Further, it is demonstrated that MICEST detection is feasible in the human brain at ultra high fields (7 T) without exceeding the allowed limits on radiofrequency specific absorption rate. Results from healthy human volunteers (N=5) showed significantly higher (p=0.03) MICEST effect from white matter (5.2±0.5%) compared to gray matter (4.3±0.5%). The mean coefficient of variations for intra-subject MICEST contrast in WM and GM were 0.49 and 0.58 respectively. Potential overlap of CEST signals from other brain metabolites with the observed MICEST map is discussed. This noninvasive approach potentially opens the way to image MI in vivo and to monitor its alteration in many disease conditions.
Copyright © 2010 Elsevier Inc. All rights reserved.
Figures


Similar articles
-
MICEST: a potential tool for non-invasive detection of molecular changes in Alzheimer's disease.J Neurosci Methods. 2013 Jan 15;212(1):87-93. doi: 10.1016/j.jneumeth.2012.09.025. Epub 2012 Oct 3. J Neurosci Methods. 2013. PMID: 23041110 Free PMC article.
-
Nuclear Overhauser enhancement (NOE) imaging in the human brain at 7T.Neuroimage. 2013 Aug 15;77:114-24. doi: 10.1016/j.neuroimage.2013.03.047. Epub 2013 Apr 6. Neuroimage. 2013. PMID: 23567889 Free PMC article.
-
Systematic Evaluation of Amide Proton Chemical Exchange Saturation Transfer at 3 T: Effects of Protein Concentration, pH, and Acquisition Parameters.Invest Radiol. 2016 Oct;51(10):635-46. doi: 10.1097/RLI.0000000000000292. Invest Radiol. 2016. PMID: 27272542
-
Magnetization Transfer Contrast and Chemical Exchange Saturation Transfer MRI. Features and analysis of the field-dependent saturation spectrum.Neuroimage. 2018 Mar;168:222-241. doi: 10.1016/j.neuroimage.2017.04.045. Epub 2017 Apr 21. Neuroimage. 2018. PMID: 28435103 Free PMC article. Review.
-
Application of chemical exchange saturation transfer (CEST) MRI for endogenous contrast at 7 Tesla.J Neuroimaging. 2013 Oct;23(4):526-32. doi: 10.1111/j.1552-6569.2012.00751.x. Epub 2013 Feb 12. J Neuroimaging. 2013. PMID: 23402307 Free PMC article. Review.
Cited by
-
Creatine CEST MRI for Differentiating Gliomas with Different Degrees of Aggressiveness.Mol Imaging Biol. 2017 Apr;19(2):225-232. doi: 10.1007/s11307-016-0995-0. Mol Imaging Biol. 2017. PMID: 27541025 Free PMC article.
-
Exchange rates of creatine kinase metabolites: feasibility of imaging creatine by chemical exchange saturation transfer MRI.NMR Biomed. 2012 Nov;25(11):1305-9. doi: 10.1002/nbm.2792. Epub 2012 Mar 20. NMR Biomed. 2012. PMID: 22431193 Free PMC article.
-
MR imaging of a novel NOE-mediated magnetization transfer with water in rat brain at 9.4 T.Magn Reson Med. 2017 Aug;78(2):588-597. doi: 10.1002/mrm.26396. Epub 2016 Sep 8. Magn Reson Med. 2017. PMID: 27604612 Free PMC article.
-
Putative Astroglial Dysfunction in Schizophrenia: A Meta-Analysis of 1H-MRS Studies of Medial Prefrontal Myo-Inositol.Front Psychiatry. 2018 Sep 21;9:438. doi: 10.3389/fpsyt.2018.00438. eCollection 2018. Front Psychiatry. 2018. PMID: 30298023 Free PMC article.
-
Genome-wide analysis of Saccharomyces cerevisiae identifies cellular processes affecting intracellular aggregation of Alzheimer's amyloid-β42: importance of lipid homeostasis.Mol Biol Cell. 2014 Aug 1;25(15):2235-49. doi: 10.1091/mbc.E13-04-0216. Epub 2014 May 28. Mol Biol Cell. 2014. PMID: 24870034 Free PMC article.
References
-
- Brand A, Richter-Landsberg C, Leibfritz D. Multinuclear NMR studies on the energy metabolism of glial and neuronal cells. Dev Neurosci. 1993;15:289–298. - PubMed
-
- Choi IY, Gruetter R. In vivo 13C NMR assessment of brain glycogen concentration and turnover in the awake rat. Neurochem Int. 2003;43:317–322. - PubMed
-
- Criego AB, Tkac I, Kumar A, Thomas W, Gruetter R, Seaquist ER. Brain glucose concentrations in healthy humans subjected to recurrent hypoglycemia. J Neurosci Res. 2005;82:525–530. - PubMed
Publication types
MeSH terms
Substances
Grants and funding
LinkOut - more resources
Full Text Sources
Other Literature Sources
Medical
