

Review
doi: 10.1016/j.micinf.2010.09.011.
Epub 2010 Oct 15.
SIV infection in natural hosts: resolution of immune activation during the acute-to-chronic transition phase
Affiliations
- PMID: 20951225
- PMCID: PMC3022004
- DOI: 10.1016/j.micinf.2010.09.011
Item in Clipboard
Review
SIV infection in natural hosts: resolution of immune activation during the acute-to-chronic transition phase
Microbes Infect.
2011 Jan.
Abstract
SIV-infected natural hosts do not progress to clinical AIDS yet display high viral replication and an acute immunologic response similar to pathogenic SIV/HIV infections. During chronic SIV infection, natural hosts suppress their immune activation, whereas pathogenic hosts display a highly activated immune state. Here, we review natural host SIV infections with an emphasis on specific immune cells and their contribution to the transition from the acute-to-chronic phases of infection.
Copyright © 2010 Institut Pasteur. Published by Elsevier SAS. All rights reserved.
Figures
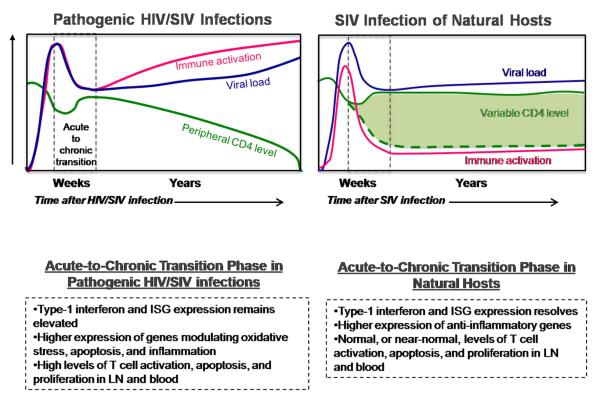
Figure summarizes the differences between pathogenic HIV/SIV infections SIV and natural host monkey species; specifically with regard to the acute-to-chronic transition phase following an SIV or HIV infection. Within the graphs the blue line represents typical viral load levels, the green line and shaded green area represent typical CD4 levels, the red line represents general systemic immune activation which can be measured in a number of ways including the activation state of the immune cells and levels of interferon stimulated genes (ISGs). Vertical dotted lines indicate the time of acute-to-chronic transition which generally occurs between approximately 21 and 40 days. Some specific differences in the acute-to-chronic phase between pathogenic and natural host infections are listed within the dashed boxes below the graphs.
References
-
- Giorgi JV, Hultin LE, McKeating JA, Johnson TD, Owens B, Jacobson LP, Shih R, Lewis J, Wiley DJ, Phair JP, Wolinsky SM, Detels R. Shorter survival in advanced human immunodeficiency virus type 1 infection is more closely associated with T lymphocyte activation than with plasma virus burden or virus chemokine coreceptor usage. J Infect Dis. 1999;179:859–870. - PubMed
-
- Orendi JM, Bloem AC, Borleffs JC, Wijnholds FJ, de Vos NM, Nottet HS, Visser MR, Snippe H, Verhoef J, Boucher CA. Activation and cell cycle antigens in CD4+ and CD8+ T cells correlate with plasma human immunodeficiency virus (HIV-1) RNA level in HIV-1 infection. J Infect Dis. 1998;178:1279–1287. - PubMed
-
- Sodora DL, Silvestri G. Immune activation and AIDS pathogenesis. AIDS. 2008;22:439–446. - PubMed
Publication types
MeSH terms
Grants and funding
LinkOut - more resources
Full Text Sources
