. 2010 Oct 19;18(4):353-66.
doi: 10.1016/j.ccr.2010.09.009.

T-lymphoblastic lymphoma cells express high levels of BCL2, S1P1, and ICAM1, leading to a blockade of tumor cell intravasation

Affiliations

T-lymphoblastic lymphoma cells express high levels of BCL2, S1P1, and ICAM1, leading to a blockade of tumor cell intravasation

Hui Feng et al. Cancer Cell. .

Erratum in

Abstract

The molecular events underlying the progression of T-lymphoblastic lymphoma (T-LBL) to acute T-lymphoblastic leukemia (T-ALL) remain elusive. In our zebrafish model, concomitant overexpression of bcl-2 with Myc accelerated T-LBL onset while inhibiting progression to T-ALL. The T-LBL cells failed to invade the vasculature and showed evidence of increased homotypic cell-cell adhesion and autophagy. Further analysis using clinical biopsy specimens revealed autophagy and increased levels of BCL2, S1P1, and ICAM1 in human T-LBL compared with T-ALL. Inhibition of S1P1 signaling in T-LBL cells led to decreased homotypic adhesion in vitro and increased tumor cell intravasation in vivo. Thus, blockade of intravasation and hematologic dissemination in T-LBL is due to elevated S1P1 signaling, increased expression of ICAM1, and augmented homotypic cell-cell adhesion.


Figures

Figure 1
Figure 1. Bcl-2 Promotes Onset but Inhibits the Progression of Myc-induced T-LBL in Zebrafish
(A) Rate of tumor onset in three transgenic zebrafish lines: hsp70-Cre;rag2-EGFP-bcl-2 (Cre;bcl-2) double-transgenic fish (n=31; green line), rag2-LDL-EGFP-Myc;hsp70-Cre (Myc;Cre) double-transgenic fish (n=26; blue line), and rag2-LDL-EGFP-Myc;hsp70-Cre;rag2-EGFP-bcl-2 (Myc;Cre;bcl-2) triple-transgenic fish (n=32; red line). (B) Rate of T-LBL progression to T-ALL in Myc;Cre (n=13; blue line) versus Myc;Cre;bcl-2 (n=21; red line) transgenic fish. (C-H) Localized GFP-labeled tumors first arose as T-LBL in Myc;Cre (C; 112-day) and Myc;Cre;bcl-2 (F; 119-day) transgenic fish; widespread dissemination leading to leukemia was seen within 11 weeks after T-LBL onset in Myc;Cre fish (D,E), but not in Myc;Cre;bcl-2 triple transgenics (G,H). (I-L) GFP-positive T-LBL tumor cells (n=5 per group) transplanted into the peritoneum of irradiated wild-type hosts. Tumor cells from the Myc;Cre double-transgenic fish disseminated rapidly (I-J), while those from the Myc;Cre;bcl-2 triple-transgenics remained localized (K-L). Scale bar for panels C-H and I-L = 1 mm. See also Figure S1.
Figure 2
Figure 2. Zebrafish T-Lymphoblasts Overexpressing Bcl-2 Spread Locally but Fail to Intravasate into Vasculature
(A,E,I) T cells in a control fish are restricted to the thymus above the gill arches and underneath the operculum (n=3). (B,C,F,G,J,K) GFP and dsRED2-positive tumor cells (arrowheads; F,G) in the Myc;Cre;bcl-2 fish invade tissues outside the thymus and infiltrate local structures, including the primary lamellae (filaments) and cartilaginous gill rays by 2 months (B,F,J; n=3) but fail to invade vasculature by 10 months (C,G,K; n=3). By contrast, GFP- and dsRED2-expressing cells of the Myc;Cre transgenic fish (D,H,L; n=3) enter secondary lamellae that contain the capillary network (compare panels J-K with panel L, arrows) and disseminate widely throughout the host, infiltrating distant muscle and fat tissues by 6 months. Black arrowhead in panel A points to thymus (T) and the gill region is indicated (G). Inserts in panels F, G, and H show enlargements of tumor cells. (M,N,O) dsRED2-expressing lymphoma cells (N) from the Myc;Cre fish intravasate into EGFP-labeled vasculature (M) of the transplant host (fli1-EGFP;Casper) by 6 day post-transplantation (see arrowheads in O); (P,Q,R) In contrast, dsRED2-expressing lymphoma cells (Q) from the Myc;Cre;bcl-2 fish fail to intravasate vasculature (P) of the transplant hosts by 6 day post-transplantation (compare panel R with O). Note aggregates of the Myc;Cre;bcl-2 lymphoma cells in panels Q and R. Scale bar for panels A-D = 200 μm; for panels E-H = 50 μm; for panels I-L and M-R = 10 μm. See also Figure S2.
Figure 3
Figure 3. Zebrafish Lymphoblasts Overexpressing Myc and Bcl-2 Undergo Autophagy
(A) Electron microscopic analysis rarely identified autophagosomes in tumor cells from Myc;Cre transgenic fish. Mitochondria are indicated by arrows. (B-D) Thymic lymphoblasts from Myc;Cre;bcl-2 triple-transgenics show prominent autophagosomes/autolysophagosomes. Panel C is a magnified view of B (box). Arrows indicate double-membrane autophagosomes containing cytoplasm and cytoplasmic organelles. An autolysophagosome is shown in panel D (arrow). (E) Quantification of autophagosomes and autolysophagosomes in Myc;Cre (solid bars) and Myc;Cre;bcl-2 (hatched bars) tumor cells were harvested from three individual fish. From 9 to 15 different cells from each fish were sectioned and analyzed. mean ± SD results from three individual fish are shown. (F) Western blot analyses of the protein levels of EGFP-zbcl-2, Lc3-I, and Lc3-II in three individual Myc;Cre and Myc;Cre;bcl-2 transgenic fish. Actin was used as a loading control in each lane. Scale bars for panels A-D = 500 nm. See also Figure S3.
Figure 4
Figure 4. Akt Activation Promotes the Progression of T-LBL to T-ALL in Myc;Cre;bcl-2 Transgenic Fish
(A) Western blot analysis of Lc3-I, Lc3-II, Ser473p-Akt, and Akt protein expression in zebrafish Myc;Cre;bcl-2 lymphoma (two tumor samples) and leukemia (three tumor samples) cells and in zebrafish Myc;Cre leukemia cells (three tumor samples). (B) Western blot analysis of Ser473p-Akt and Akt expression in Myc;Cre;bcl-2 (n=4) and Myc;Cre;bcl-2;Myr-Akt2 (n=4) zebrafish lymphomas. (C-F) Upon constitutive activation of Myr-Akt2, Myc;Cre;bcl-2 transgenic fish rapidly progress from T-LBL (E; T-LBL onset at 20 days) to T-ALL (F; at 34 days), compared with the Myc;Cre;bcl-2 transgenic fish lacking Myr-Akt2 expression (C-D). (G) Rate of T-LBL progression to T-ALL in Myc;Cre;bcl-2 transgenic fish (n=10; red) and Myc;Cre;bcl-2;Akt2 transgenic fish (n=20; purple). Actin protein levels in panels A-B served as loading controls. Scale bars for panels C-F = 1 mm. See also Figure S4.
Figure 5
Figure 5. Human T-LBLs Undergo Autophagy and Overexpress BCL2α, S1P1 and ICAM1
(A) Western blot showing protein levels of MCL1, BCLXL, BCL2α, LC3-I, LC3-II, BECLIN 1, S1P1, and ACTIN in six T-LBL versus six T-ALL human patient samples. (B) Western blot showing the levels of ICAM1, LFA1, E-Cad, N-Cad, CD99, and ACTIN in 6 T-LBL versus 6 T-ALL human patient samples. (C) Gene expression profiling of human T-LBL and T-ALL samples shows that BCL2α is expressed at high levels in T-LBL but not T-ALL samples. (D) BCL2α versus ACTIN protein ratios demonstrating that BCL2α levels are significantly higher in human T-LBL samples compared with T-ALL samples (n=6 for T-LBL and n=7 for T-ALL; to view the Western blot, see Figure S5B). (E) S1P1 versus ACTIN protein ratios demonstrating that S1P1 protein levels are significantly higher in human T-LBL samples compared to T-ALL samples. (F) ICAM1 versus ACTIN protein ratios demonstrating the significantly higher ICAM1 in human T-LBL samples compared to T-ALL samples. (G-L) Immunofluorescent staining indicates the subcellular localization of LC3 in normal thymus (G), T-LBL (H), and T-ALL (I) cells. (J-L) DAPI staining of the cells shown in G-I, respectively. AU stands for arbitrary units. Bars denote median values. Scale bars for panels G-L = 10 μm. See also Figure S5 and Table S1.
Figure 6
Figure 6. Immunohistochemical analysis of BCL2 and S1P1 in human T-LBL and T-ALL
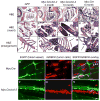
(A-F) Human BCL2 detected by immunohistochemistry in normal thymus (A,D) and in samples from patients with T-LBL (B,E) or T-ALL (C,F). Panels D-F are magnified views of boxes in A-C, respectively, and insets show individual cells including a mature thymocyte with high BCL2 expression. (G-L) Human S1P1 detected by immunohistochemistry in normal thymus (G,J) and in samples from patients with T-LBL (H,K) and T-ALL (I,L). Panels J-L are magnified views of boxes in G-I, respectively. Note the reciprocal expression pattern of BCL2 and S1P1 in the thymic cortex and medulla regions. The thick arrow in panel (A,G) shows the thymic medulla region, while thin arrows in panels (D-F) indicate mature thymocytes with high BCL2 expression, Arrowheads in panels (J-L) show the S1P1 expression on the cortical thymocytes or lymphoblasts. Scale bars for panels A-C and G-I = 0.5mm; D-F and J-L =50 μm. See also Figure S6 and Table S2.
Figure 7
Figure 7. Bcl-2-Overexpressing T-LBL Cells Display Increased Aggregation That Can Be Overcome by Akt Activation and S1P1 Inhibition in-vitro
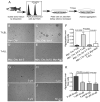
(A) Schematic of the experimental strategy. (B-E) Brightfield images of lymphoma or leukemic tumor cells in culture for 7 days on ZKS stroma: (B) Myc;Cre T-LBL, (C) Myc;Cre;bcl-2 T-LBL, (D) Myc;Cre;bcl-2 T-ALL, or (E) Myc;Cre;bcl-2;Myr-Akt2 T-ALL cells. (F) Quantification of aggregates over free cells for tumor cell culture on ZKS cells under normal conditions for 7 days: Myc;Cre T-LBL (n=10), Myc;Cre;bcl-2 T-LBL (n=11), Myc;Cre;bcl-2 T-ALL (n=13), or Myc;Cre;bcl-2;Myr-Akt2 T-ALL (n=11) transgenic fish. (G-J) The formation of homotypic cell aggregation of Myc;Cre;bcl-2 T-LBL cells is inhibited after treatment with a specific S1P1 antagonist W146 (1μM, 5μM, and 50μM) in ZKS stroma supported cell culture. (K) Ratio of cell aggregates to free cells in Myc;Cre;bcl-2 T-LBL cells 7 days after plating on ZKS stroma with vehicle only, or increasing amounts of W146 (n=4 per group) ranging from 1μM to 50μM treatment. Bars in panels F and K represent means determined from independent animals; and error bars represent standard deviation of the mean. Scale bar for panels B-E and G-J = 40 μm. See also Figure S7.
Figure 8
Figure 8. The Selective S1P1 Antagonist W146 Promotes Intravasation of Bcl-2-overexpressing T-LBL cells in vivo
(A) Schematic drawing of the experimental strategy. (B-G) Confocal images of EGFP-labeled blood vessels (B, E), dsRED2-labeled lymphoma cells (C,F), and the merged images of a vehicle-treated (D; n=29) and a W146-treated transplanted animal (G; n=18) demonstrate that W146 treatment promotes intravasation of bcl-2-overexpressing lymphoma cells (arrowheads) in vivo (compare panel G to D). Note that W146 treatment also inhibited the in vivo formation of lymphoma cell aggregates (compare panel F to C). Scale bar for panels B-G = 10 μM.

Comment in

References

    1. Asker C, Wiman KG, Selivanova G. p53-induced apoptosis as a safeguard against cancer. Biochem Biophys Res Commun. 1999;265:1–6. - PubMed
    1. Amaravadi RK, Yu D, Lum JJ, Bui T, Christophorou MA, Evan GI, Thomas-Tikhonenko A, Thompson CB. Autophagy inhibition enhances therapyinduced apoptosis in a Myc-induced model of lymphoma. J Clin Invest. 2007;117:326–336. - PMC - PubMed
    1. Bernard G, Zoccola D, Deckert M, Breittmayer JP, Aussel C, Bernard A. The E2 molecule (CD99) specifically triggers homotypic aggregation of CD4+ CD8+ thymocytes. J Immunol. 1995;154(1):26–32. - PubMed
    1. Cairo MS, Raetz E, Lim MS, Davenport V, Perkins SL. Childhood and adolescent non-Hodgkin lymphoma: new insights in biology and critical challenges for the future. Pediatric blood & cancer. 2005;45:753–769. - PubMed
    1. Cao Y, Klionsky DJ. Physiological functions of Atg6/Beclin 1: a unique autophagy-related protein. Cell Res. 2007;17:839–849. - PubMed

Publication types

MeSH terms

Substances

LinkOut - more resources